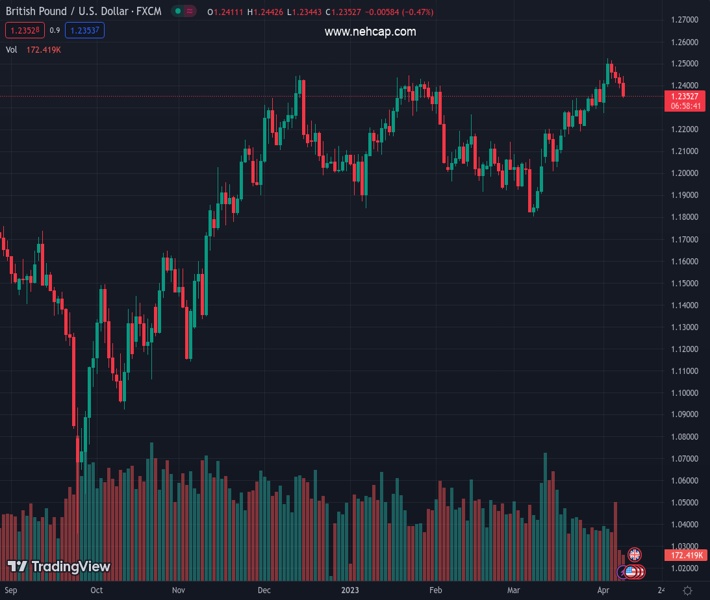
#GBPUSD @ 1.23550 US Dollar gains momentum as stocks slide and Treasury yields rise. (Pivot Orderbook analysis)
…
This is a premium post.
[s2If !current_user_can(access_s2member_level4)]Please register for PREMIUM VERSION HERE to read full post below containing analysis. In case of any error or you think you are not able to read the full post below, please email us at support#nehcap.com [lwa][/s2If] [s2If current_user_can(access_s2member_level4)]
- US Dollar gains momentum as stocks slide and Treasury yields rise.
- GBP/USD looks bearish, near the 1.2340 support.
The pair currently trades last at 1.23550.
The previous day high was 1.2456 while the previous day low was 1.2389. The daily 38.2% Fib levels comes at 1.2415, expected to provide resistance. Similarly, the daily 61.8% fib level is at 1.243, expected to provide resistance.
The GBP/USD broke below 1.2380 and tumbled to 1.2342, reaching the lowest level in a week amid a stronger US Dollar across the board. The Greenback gained momentum during the American session as US yields moved to the upside.
The US Dollar Index is rising for the fourth consecutive session. It is hovering around 102.65, up 0.57% for the day, at the highest level in a week as it continues to bounce from monthly lows.
Higher US yields are helping the Greenback on Monday following the latest US economic data. The US 10-year yield stands at 3.41%, a one-week high. After the release of the Nonfarm Payrolls report on Friday, market participants are turning their focus to the US Consumer Price Index number are out on Wednesday. After the NFP, the odds of another rate hike at the FOMC May meeting rose.
The US Dollar is driving price action on Monday. Most European markets were closed. In Wall Street, the Dow Jones is falling 0.20%, and the Nasdaq drops by 1.25% after the first minutes of trading.
Technical indicators favor the downside for the moment; however, after the sharp decline, some consolidation and a rebound seem likely. A recovery above 1.2395 would alleviate the bearish pressure, while above 1.2440 the outlook would change to bullish.
The immediate support is around the 1.2340 area. A break lower should point to further losses, targeting initially the 1.2290 support area followed by last week’s low at 1.2270.
Technical Levels: Supports and Resistances
GBPUSD currently trading at 1.2357 at the time of writing. Pair opened at 1.2418 and is trading with a change of -0.49 % .
| Overview | Overview.1 | |
|---|---|---|
| 0 | Today last price | 1.2357 |
| 1 | Today Daily Change | -0.0061 |
| 2 | Today Daily Change % | -0.4900 |
| 3 | Today daily open | 1.2418 |
The pair remains strongly bullish on the daily timeframe. It trades above its 20 SMA @ 1.2293, 50 SMA 1.2156, 100 SMA @ 1.2159 and 200 SMA @ 1.1902.
| Trends | Trends.1 | |
|---|---|---|
| 0 | Daily SMA20 | 1.2293 |
| 1 | Daily SMA50 | 1.2156 |
| 2 | Daily SMA100 | 1.2159 |
| 3 | Daily SMA200 | 1.1902 |
The previous day high was 1.2456 while the previous day low was 1.2389. The daily 38.2% Fib levels comes at 1.2415, expected to provide resistance. Similarly, the daily 61.8% fib level is at 1.243, expected to provide resistance.
Note the levels of interest below:
- Pivot support is noted at 1.2386, 1.2354, 1.2319
- Pivot resistance is noted at 1.2453, 1.2488, 1.252
| Levels | Levels.1 |
|---|---|
| Previous Daily High | 1.2456 |
| Previous Daily Low | 1.2389 |
| Previous Weekly High | 1.2525 |
| Previous Weekly Low | 1.2275 |
| Previous Monthly High | 1.2424 |
| Previous Monthly Low | 1.1803 |
| Daily Fibonacci 38.2% | 1.2415 |
| Daily Fibonacci 61.8% | 1.2430 |
| Daily Pivot Point S1 | 1.2386 |
| Daily Pivot Point S2 | 1.2354 |
| Daily Pivot Point S3 | 1.2319 |
| Daily Pivot Point R1 | 1.2453 |
| Daily Pivot Point R2 | 1.2488 |
| Daily Pivot Point R3 | 1.2520 |
[/s2If]
Join Our Telegram Group


