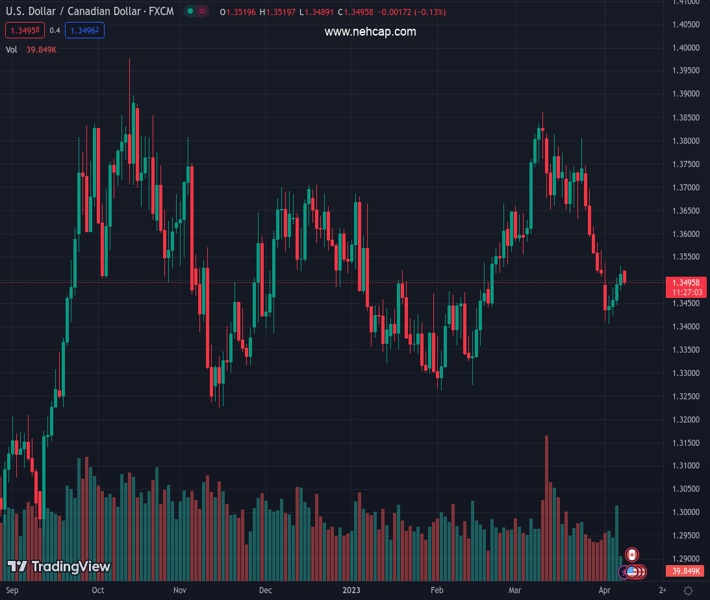
#USDCAD @ 1.34952 drifts lower on Monday and is weighed down by a combination of factors. (Pivot Orderbook analysis)
…
This is a premium post.
[s2If !current_user_can(access_s2member_level4)]Please register for PREMIUM VERSION HERE to read full post below containing analysis. In case of any error or you think you are not able to read the full post below, please email us at support#nehcap.com [lwa][/s2If] [s2If current_user_can(access_s2member_level4)]
- USD/CAD drifts lower on Monday and is weighed down by a combination of factors.
- Bullish Oil prices underpin the Loonie and exert pressure amid fresh USD selling.
- The downside seems cushioned ahead of this week’s key central bank event risks.
The pair currently trades last at 1.34952.
The previous day high was 1.3531 while the previous day low was 1.3478. The daily 38.2% Fib levels comes at 1.3511, expected to provide resistance. Similarly, the daily 61.8% fib level is at 1.3498, expected to provide resistance.
The USD/CAD pair attracts some sellers near the 1.3520 region on Monday and snaps a four-day winning streak. The pair is currently placed just below the 1.3500 psychological mark, down nearly 0.10% for the day, and is pressured by a combination of factors.
Crude Oil prices hold steady near a multi-month top touched last week in reaction to a new round of production cuts announced by the OPEC+, which, to a larger extent, overshadows concerns that weakening global growth may dent fuel demand. This, in turn, is seen underpinning the commodity-linked Loonie and exerting some downward pressure on the USD/CAD pair amid the emergence of some intraday selling around the US Dollar (USD).
In fact, the USD Index, which tracks the Greenback against a basket of currencies, surrenders its modest intraday gains amid the uncertainty over the Federal Reserve’s (Fed) rate hike path. The mostly upbeat US NFP released on Friday revived bets for another 25 bps lift-off at the next FOMC meeting in May. Market participants, however, seem convinced that the Fed will cut rates in the second half of the year amid signs of slowing economic growth.
Expectations that the Fed is nearly done with its policy tightening lead to a fresh leg down in the US Treasury bond yields, which continue to act as a headwind for the buck and prompt fresh selling around the USD/CAD pair. The downside, however, seems cushioned as traders might refrain from placing aggressive bets ahead of the key central bank event risks – the Bank of Canada policy meeting and the release of the FOMC meeting minutes on Wednesday.
This week’s US economic docket also features the release of the latest consumer inflation figures and monthly retail sales data, which will play a key role in influencing the USD and provide a fresh directional impetus to the USD/CAD pair. In the meantime, relatively thin liquidity conditions, in the wake of a holiday in most European markets, might hold back traders from placing aggressive bets and contributes to limiting losses for the major.
Technical Levels: Supports and Resistances
USDCAD currently trading at 1.3498 at the time of writing. Pair opened at 1.3516 and is trading with a change of -0.13 % .
| Overview | Overview.1 | |
|---|---|---|
| 0 | Today last price | 1.3498 |
| 1 | Today Daily Change | -0.0018 |
| 2 | Today Daily Change % | -0.1300 |
| 3 | Today daily open | 1.3516 |
The pair is trading below its 20 Daily moving average @ 1.3621, below its 50 Daily moving average @ 1.3555 , below its 100 Daily moving average @ 1.3529 and above its 200 Daily moving average @ 1.339
| Trends | Trends.1 | |
|---|---|---|
| 0 | Daily SMA20 | 1.3621 |
| 1 | Daily SMA50 | 1.3555 |
| 2 | Daily SMA100 | 1.3529 |
| 3 | Daily SMA200 | 1.3390 |
The previous day high was 1.3531 while the previous day low was 1.3478. The daily 38.2% Fib levels comes at 1.3511, expected to provide resistance. Similarly, the daily 61.8% fib level is at 1.3498, expected to provide resistance.
Note the levels of interest below:
- Pivot support is noted at 1.3486, 1.3456, 1.3433
- Pivot resistance is noted at 1.3539, 1.3561, 1.3592
| Levels | Levels.1 |
|---|---|
| Previous Daily High | 1.3531 |
| Previous Daily Low | 1.3478 |
| Previous Weekly High | 1.3537 |
| Previous Weekly Low | 1.3406 |
| Previous Monthly High | 1.3862 |
| Previous Monthly Low | 1.3508 |
| Daily Fibonacci 38.2% | 1.3511 |
| Daily Fibonacci 61.8% | 1.3498 |
| Daily Pivot Point S1 | 1.3486 |
| Daily Pivot Point S2 | 1.3456 |
| Daily Pivot Point S3 | 1.3433 |
| Daily Pivot Point R1 | 1.3539 |
| Daily Pivot Point R2 | 1.3561 |
| Daily Pivot Point R3 | 1.3592 |
[/s2If]
Join Our Telegram Group


