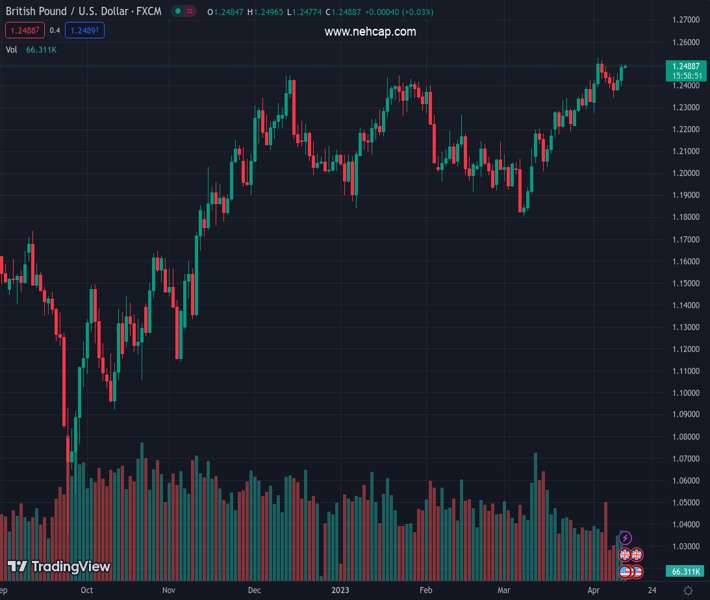
#GBPUSD @ 1.24307 attracts some dip-buying on Monday and snaps a three-day losing streak. (Pivot Orderbook analysis)
…
This is a premium post.
[s2If !current_user_can(access_s2member_level4)]Please register for PREMIUM VERSION HERE to read full post below containing analysis. In case of any error or you think you are not able to read the full post below, please email us at support#nehcap.com [lwa][/s2If] [s2If current_user_can(access_s2member_level4)]
- GBP/USD attracts some dip-buying on Monday and snaps a three-day losing streak.
- The USD surrenders its modest intraday gains and lends some support to the major.
- Bulls lack conviction amid the uncertainty over the next move by the Fed and the BoE.
The pair currently trades last at 1.24307.
The previous day high was 1.2456 while the previous day low was 1.2389. The daily 38.2% Fib levels comes at 1.2415, expected to provide support. Similarly, the daily 61.8% fib level is at 1.243, expected to provide support.
The GBP/USD pair reverses an intraday dip to sub-1.2400 levels and turns positive during the first half of the European session, though lacks follow-through. The pair currently trades around the 1.2420-1.2425 region, up less than 0.10%, and for now, seems to have snapped a three-day losing streak.
The US Dollar (USD) struggles to preserve its modest intraday gains amid the uncertainty over the Federal Reserve’s (Fed) rate-hike path and turns out to be a key factor lending some support to the GBP/USD pair. The mostly upbeat US NFP released on Friday revived bets for another 25 bps lift-off at the next FOMC meeting in May. Market participants, however, seem convinced that the Fed will cut rates in the second half of the year amid signs of slowing economic growth. This is reinforced by a fresh leg down in the US Treasury bond yields, which acts as a headwind for the Greenback.
The upside for the GBP/USD pair, meanwhile, remains capped in the wake of the recent mixed signals from the Bank of England (BoE) members over the next policy move. It is worth recalling that the BoE MPC member Silvana Tenreyro advocated last Tuesday for the consideration of cutting rates sooner than thought as the absence of cost-push shocks would bring down inflation well below targets. In contrast, the BoE Chief Economist Huw Pill said that action is still needed in assessing inflation prospects and that the onus remains on ensuring enough policy tightening is delivered to see the job through.
Given that most European markets are closed in observance of Easter Monday, the aforementioned mixed fundamental backdrop is holding back traders from placing aggressive bullish bets around the GBP/USD pair amid relatively thin liquidity. Investors also seem reluctant and prefer to move to the sidelines ahead of the FOMC meeting minutes, due on Wednesday. This week’s US economic docket also features the release of the latest consumer inflation figures and monthly retail sales data. This will play a key role in influencing the USD and provide a fresh directional impetus to the major.
Technical Levels: Supports and Resistances
GBPUSD currently trading at 1.2428 at the time of writing. Pair opened at 1.2418 and is trading with a change of 0.08 % .
| Overview | Overview.1 | |
|---|---|---|
| 0 | Today last price | 1.2428 |
| 1 | Today Daily Change | 0.0010 |
| 2 | Today Daily Change % | 0.0800 |
| 3 | Today daily open | 1.2418 |
The pair remains strongly bullish on the daily timeframe. It trades above its 20 SMA @ 1.2293, 50 SMA 1.2156, 100 SMA @ 1.2159 and 200 SMA @ 1.1902.
| Trends | Trends.1 | |
|---|---|---|
| 0 | Daily SMA20 | 1.2293 |
| 1 | Daily SMA50 | 1.2156 |
| 2 | Daily SMA100 | 1.2159 |
| 3 | Daily SMA200 | 1.1902 |
The previous day high was 1.2456 while the previous day low was 1.2389. The daily 38.2% Fib levels comes at 1.2415, expected to provide support. Similarly, the daily 61.8% fib level is at 1.243, expected to provide support.
Note the levels of interest below:
- Pivot support is noted at 1.2386, 1.2354, 1.2319
- Pivot resistance is noted at 1.2453, 1.2488, 1.252
| Levels | Levels.1 |
|---|---|
| Previous Daily High | 1.2456 |
| Previous Daily Low | 1.2389 |
| Previous Weekly High | 1.2525 |
| Previous Weekly Low | 1.2275 |
| Previous Monthly High | 1.2424 |
| Previous Monthly Low | 1.1803 |
| Daily Fibonacci 38.2% | 1.2415 |
| Daily Fibonacci 61.8% | 1.2430 |
| Daily Pivot Point S1 | 1.2386 |
| Daily Pivot Point S2 | 1.2354 |
| Daily Pivot Point S3 | 1.2319 |
| Daily Pivot Point R1 | 1.2453 |
| Daily Pivot Point R2 | 1.2488 |
| Daily Pivot Point R3 | 1.2520 |
[/s2If]
Join Our Telegram Group


