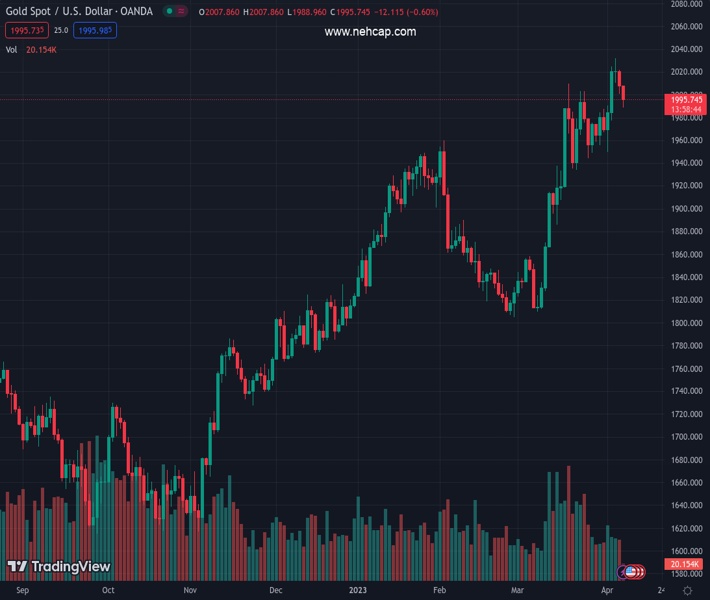
#XAUUSD @ 1,995.80 Gold price pares the first weekly gains in three, bounces off 200-EMA at the latest., @nehcap view: Further downside expected (Pivot Orderbook analysis)
…
This is a premium post.
[s2If !current_user_can(access_s2member_level4)]Please register for PREMIUM VERSION HERE to read full post below containing analysis. In case of any error or you think you are not able to read the full post below, please email us at support#nehcap.com [lwa][/s2If] [s2If current_user_can(access_s2member_level4)]
- Gold price pares the first weekly gains in three, bounces off 200-EMA at the latest.
- China-inflicted risk aversion, hawkish Fed bets underpin US Dollar’s corrective bounce after four-week downtrend.
- XAU/USD bears remain cautious ahead of key support.
- Easter Monday holidays, anxiety ahead of US inflation, Fed Minutes add filters to Gold price.
The pair currently trades last at 1995.80.
The previous day high was 2021.5 while the previous day low was 2000.93. The daily 38.2% Fib levels comes at 2008.79, expected to provide resistance. Similarly, the daily 61.8% fib level is at 2013.64, expected to provide resistance.
Gold price (XAU/USD) trims intraday losses around $1,995 amid the Easter Monday holiday in major bourses. In doing so, the bullion bounces off the 200-bar Exponential Moving Average (EMA) but remains mildly offered on a day, which in turn teases sellers after the bullion marked the first weekly gains in three at the last.
That said, the China-linked risk-off mood joins the US Dollar’s rebound to exert downside pressure on the Gold price. However, the market’s latest inaction limits the XAU/USD moves of late. Recently, South Korea joined the US in defending Taiwan as Beijing marks a heavy show of military drills. Even so, the terms of tension are still inexplicable as the US signals the latest moves of sending arms help to Taipei as precautionary and resists taking major steps.
Elsewhere, Friday’s better-than-forecast prints of the US Nonfarm Payrolls (NFP) renew hawkish Fed bets and suggest a 0.25% rate hike by the US central bank versus previously expected inaction.
It should be noted, however, that the downbeat US Treasury bond yields and the overall weak US statistics prod the US Dollar bulls and allow the Gold buyers to remain hopeful ahead of the US Consumer Price Index (CPI) data and the latest Federal Open Market Committee (FOMC) Monetary Policy Meeting Minutes.
While portraying the mood, the S&P 500 Futures print mild losses around 4,130, after a two-day uptrend, whereas the US 10-year and two-year Treasury bond yields remain pressured near 3.37% and 3.95% respectively. In doing so, the benchmark bond coupons extend the previous day’s losses and portray the market’s rush toward the risk-safety amid economic slowdown fears. Further, the US Dollar Index (DXY) prints mild gains around 102.20 while extending the last Tuesday’s rebound from a two-month low.
Moving on, Gold traders should pay attention to the geopolitical headlines for intraday directions while US inflation and Fed Minutes will be crucial for a clear guide afterward.
Gold price remains depressed as XAU/USD breaks the one-week-old ascending support line, now resistance, as well as the 50-bar Exponential Moving Average (EMA) surrounding $2,007, to lure Gold sellers.
Even so, the 200-EMA and previous resistance line from March 20, respectively near $1,990 and $1,982, can challenge the Gold price downside ahead of welcoming the bears.
In that case, an ascending support line from March 22, close to $1958, will be on the XAU/USD seller’s radar.
Meanwhile, recovery moves remain elusive unless crossing the 50-EMA hurdle of $2,007. Following that, the recent high near $2,035 and previous support line from April 03, now resistance around $2,040, can test the Gold buyers.
Should the precious metal remains firmer past $2,040, the previous yearly top surrounding $2,070 and the all-time high marked in 2020 around $2,075 will be in focus.
Trend: Further downside expected
Technical Levels: Supports and Resistances
XAUUSD currently trading at 1995.3 at the time of writing. Pair opened at 2007.82 and is trading with a change of -0.62% % .
| Overview | Overview.1 | |
|---|---|---|
| 0 | Today last price | 1995.3 |
| 1 | Today Daily Change | -12.52 |
| 2 | Today Daily Change % | -0.62% |
| 3 | Today daily open | 2007.82 |
The pair remains strongly bullish on the daily timeframe. It trades above its 20 SMA @ 1962.7, 50 SMA 1898.83, 100 SMA @ 1862.26 and 200 SMA @ 1787.74.
| Trends | Trends.1 | |
|---|---|---|
| 0 | Daily SMA20 | 1962.70 |
| 1 | Daily SMA50 | 1898.83 |
| 2 | Daily SMA100 | 1862.26 |
| 3 | Daily SMA200 | 1787.74 |
The previous day high was 2021.5 while the previous day low was 2000.93. The daily 38.2% Fib levels comes at 2008.79, expected to provide resistance. Similarly, the daily 61.8% fib level is at 2013.64, expected to provide resistance.
Note the levels of interest below:
- Pivot support is noted at 1998.67, 1989.51, 1978.1
- Pivot resistance is noted at 2019.24, 2030.65, 2039.81
| Levels | Levels.1 |
|---|---|
| Previous Daily High | 2021.50 |
| Previous Daily Low | 2000.93 |
| Previous Weekly High | 2032.11 |
| Previous Weekly Low | 1949.83 |
| Previous Monthly High | 2009.88 |
| Previous Monthly Low | 1809.46 |
| Daily Fibonacci 38.2% | 2008.79 |
| Daily Fibonacci 61.8% | 2013.64 |
| Daily Pivot Point S1 | 1998.67 |
| Daily Pivot Point S2 | 1989.51 |
| Daily Pivot Point S3 | 1978.10 |
| Daily Pivot Point R1 | 2019.24 |
| Daily Pivot Point R2 | 2030.65 |
| Daily Pivot Point R3 | 2039.81 |
[/s2If]
Join Our Telegram Group


