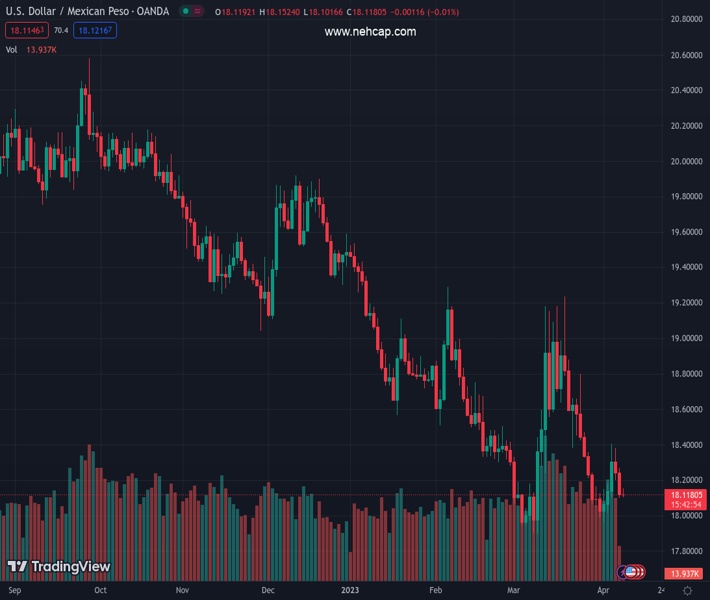
#USDMXN @ 18.1156 is eyeing more weakness below 18.10 as USD Index has witnessed exhaustion in the upside momentum. (Pivot Orderbook analysis)
…
This is a premium post.
[s2If !current_user_can(access_s2member_level4)]Please register for PREMIUM VERSION HERE to read full post below containing analysis. In case of any error or you think you are not able to read the full post below, please email us at support#nehcap.com [lwa][/s2If] [s2If current_user_can(access_s2member_level4)]
- USD/MXN is eyeing more weakness below 18.10 as USD Index has witnessed exhaustion in the upside momentum.
- The USD Index is struggling to expand gains further as investors are ignoring volatility ahead of US inflation data.
- USD/MXN is expected to continue further downside amid Darvas Box formation.
The pair currently trades last at 18.1156.
The previous day high was 18.2678 while the previous day low was 18.1004. The daily 38.2% Fib levels comes at 18.1643, expected to provide resistance. Similarly, the daily 61.8% fib level is at 18.2039, expected to provide resistance.
The USD/MXN pair has gauged an intermediate cushion after a sheer downside around 18.10 in the Asian session. The asset is hovering near the aforementioned support but is likely to face selling pressure as the US Dollar Index (DXY) has witnessed exhaustion in its upside journey.
The USD Index is struggling to expand gains further as investors are ignoring volatility ahead of US inflation data. Topsy-turvy moves are expected from the USD Index as the US inflation is expected to display some surprises.
Investors are divided about US inflation figures as one school of thought is favoring further softening of inflation as higher rates might have dampened retail demand, While, others are expecting a surprise rebound as labor market conditions are extremely solid.
On an hourly scale, USD/MXN is expected to continue the downside move amid the trend-following characteristic of Darvas Box chart formation. The formation of Darvas Box indicates an inventory adjustment phase between institutional investors and retail participants. Currently, the Darvas Box is forming in a range of 18.10-18.15. Horizontal support is placed from April 03 low at 17.96.
The 20-period Exponential Moving Average (EMA) at 18.15 is acting as a barricade for the US Dollar bulls.
Adding to that, the Relative Strength Index (RSI) (14) has shifted into the bearish range of 20.00-40.00 range, indicating more weakness ahead.
Going forward, a decisive break below April 07 low at 18.10 would expose the asset to the horizontal support plotted from April 03 low at 17.96. Further crack below the latter would expose the asset to a fresh five-year low at 17.75.
Alternatively, a break above March 24 high at 18.78 will expose the asset to March 17 high at 18.95 and March 20 high at 19.23.
Technical Levels: Supports and Resistances
USDMXN currently trading at 18.1208 at the time of writing. Pair opened at 18.1204 and is trading with a change of 0.0 % .
| Overview | Overview.1 | |
|---|---|---|
| 0 | Today last price | 18.1208 |
| 1 | Today Daily Change | 0.0004 |
| 2 | Today Daily Change % | 0.0000 |
| 3 | Today daily open | 18.1204 |
The pair remains strongly bearish on the daily time frame. It trades below the 20 SMA @ 18.4402, 50 SMA 18.4689, 100 SMA @ 18.8904 and 200 SMA @ 19.4834.
| Trends | Trends.1 | |
|---|---|---|
| 0 | Daily SMA20 | 18.4402 |
| 1 | Daily SMA50 | 18.4689 |
| 2 | Daily SMA100 | 18.8904 |
| 3 | Daily SMA200 | 19.4834 |
The previous day high was 18.2678 while the previous day low was 18.1004. The daily 38.2% Fib levels comes at 18.1643, expected to provide resistance. Similarly, the daily 61.8% fib level is at 18.2039, expected to provide resistance.
Note the levels of interest below:
- Pivot support is noted at 18.0579, 17.9954, 17.8905
- Pivot resistance is noted at 18.2254, 18.3303, 18.3928
| Levels | Levels.1 |
|---|---|
| Previous Daily High | 18.2678 |
| Previous Daily Low | 18.1004 |
| Previous Weekly High | 18.4018 |
| Previous Weekly Low | 17.9660 |
| Previous Monthly High | 19.2324 |
| Previous Monthly Low | 17.8977 |
| Daily Fibonacci 38.2% | 18.1643 |
| Daily Fibonacci 61.8% | 18.2039 |
| Daily Pivot Point S1 | 18.0579 |
| Daily Pivot Point S2 | 17.9954 |
| Daily Pivot Point S3 | 17.8905 |
| Daily Pivot Point R1 | 18.2254 |
| Daily Pivot Point R2 | 18.3303 |
| Daily Pivot Point R3 | 18.3928 |
[/s2If]
Join Our Telegram Group


