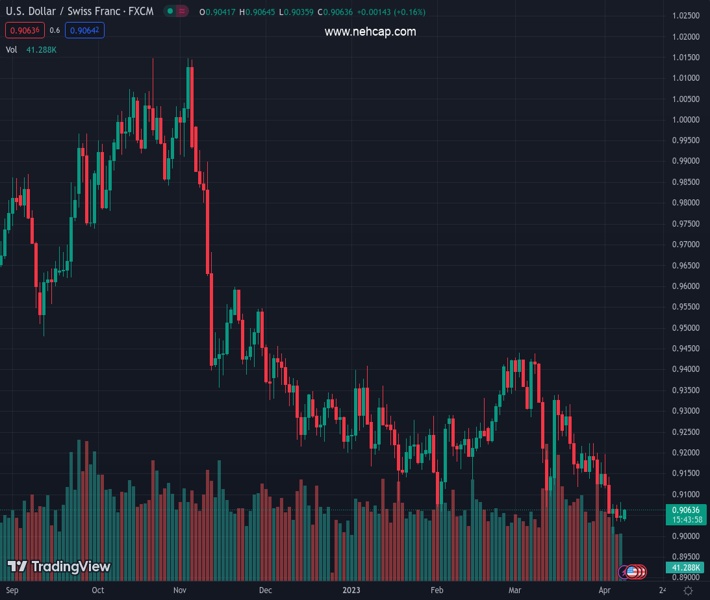
#USDCHF @ 0.90628 picks up bids to refresh intraday high, extend previous week’s rebound from 22-month low., @nehcap view: Limited recovery expected (Pivot Orderbook analysis)
…
This is a premium post.
[s2If !current_user_can(access_s2member_level4)]Please register for PREMIUM VERSION HERE to read full post below containing analysis. In case of any error or you think you are not able to read the full post below, please email us at support#nehcap.com [lwa][/s2If] [s2If current_user_can(access_s2member_level4)]
- USD/CHF picks up bids to refresh intraday high, extend previous week’s rebound from 22-month low.
- Bullish MACD signals allow USD/CHF to consolidate recent losses but March’s low guards immediate upside.
- Multiple resistance lines, 100-SMA stand tall to challenge USD/CHF bulls.
- Sellers need validation from 0.9035 to aim for fresh multi-month low.
The pair currently trades last at 0.90628.
The previous day high was 0.9082 while the previous day low was 0.9034. The daily 38.2% Fib levels comes at 0.9064, expected to provide resistance. Similarly, the daily 61.8% fib level is at 0.9052, expected to provide support.
USD/CHF renews its intraday high near 0.9065 during early Easter Monday in Europe. In doing so, the Swiss Franc (CHF) pair extends the previous day’s recovery from a 22-month low while approaching a one-month-old support-turned-resistance surrounding 0.9075.
It’s worth noting that the bullish MACD signals join the corrective bounce off the multi-day low to lure USD/CHF buyers as they approach the previous support near 0.9075.
Even if the quote manages to stay firmer past 0.9075, downward-sloping resistance lines from March 26 and 15, respectively near 0.9095 and 0.9145, can check the USD/CHF buyers.
Even so, the Swiss currency pair buyers need to portray a successful upside break of the 100-bar Simple Moving Average (SMA), around 0.9160, to please the USD/CHF buyers.
Following that, 0.9225 and a late March swing high of around 0.9345 will be in focus.
On the flip side, multiple lows around 0.9035-30 can test the USD/CHF bears before recalling them to the driver’s seat. However, the 0.9000 psychological magnet may challenge the sellers afterward.
In a case where USD/CHF remains bearish past 0.9000, June 2021 low near 0.8925 may lure the sellers.
Trend: Limited recovery expected
Technical Levels: Supports and Resistances
USDCHF currently trading at 0.9063 at the time of writing. Pair opened at 0.9054 and is trading with a change of 0.10% % .
| Overview | Overview.1 | |
|---|---|---|
| 0 | Today last price | 0.9063 |
| 1 | Today Daily Change | 0.0009 |
| 2 | Today Daily Change % | 0.10% |
| 3 | Today daily open | 0.9054 |
The pair remains strongly bearish on the daily time frame. It trades below the 20 SMA @ 0.9168, 50 SMA 0.9236, 100 SMA @ 0.9277 and 200 SMA @ 0.9507.
| Trends | Trends.1 | |
|---|---|---|
| 0 | Daily SMA20 | 0.9168 |
| 1 | Daily SMA50 | 0.9236 |
| 2 | Daily SMA100 | 0.9277 |
| 3 | Daily SMA200 | 0.9507 |
The previous day high was 0.9082 while the previous day low was 0.9034. The daily 38.2% Fib levels comes at 0.9064, expected to provide resistance. Similarly, the daily 61.8% fib level is at 0.9052, expected to provide support.
Note the levels of interest below:
- Pivot support is noted at 0.9032, 0.901, 0.8985
- Pivot resistance is noted at 0.9079, 0.9104, 0.9126
| Levels | Levels.1 |
|---|---|
| Previous Daily High | 0.9082 |
| Previous Daily Low | 0.9034 |
| Previous Weekly High | 0.9198 |
| Previous Weekly Low | 0.9007 |
| Previous Monthly High | 0.9440 |
| Previous Monthly Low | 0.9072 |
| Daily Fibonacci 38.2% | 0.9064 |
| Daily Fibonacci 61.8% | 0.9052 |
| Daily Pivot Point S1 | 0.9032 |
| Daily Pivot Point S2 | 0.9010 |
| Daily Pivot Point S3 | 0.8985 |
| Daily Pivot Point R1 | 0.9079 |
| Daily Pivot Point R2 | 0.9104 |
| Daily Pivot Point R3 | 0.9126 |
[/s2If]
Join Our Telegram Group


