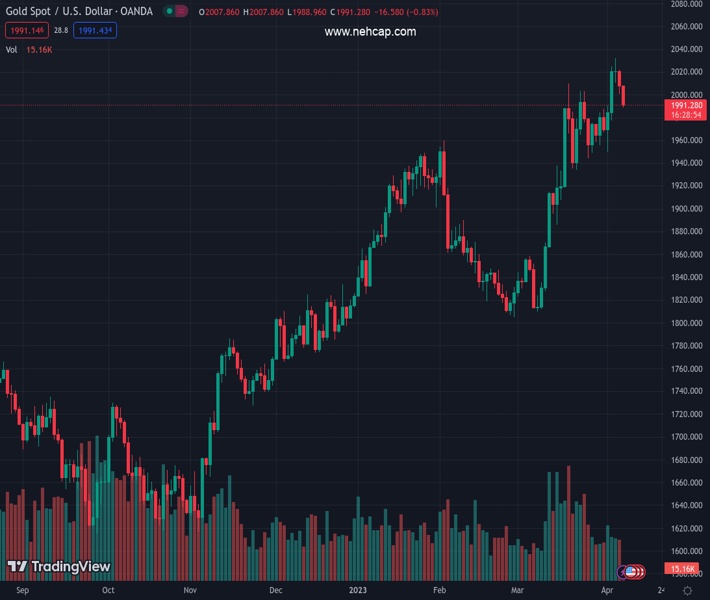
#XAUUSD @ 1,991.53 Gold price has stretched its downside to near $1,990.00 amid steep recovery in the USD Index. (Pivot Orderbook analysis)
…
This is a premium post.
[s2If !current_user_can(access_s2member_level4)]Please register for PREMIUM VERSION HERE to read full post below containing analysis. In case of any error or you think you are not able to read the full post below, please email us at support#nehcap.com [lwa][/s2If] [s2If current_user_can(access_s2member_level4)]
- Gold price has stretched its downside to near $1,990.00 amid steep recovery in the USD Index.
- Investors are anticipating a rebound in US inflation figures amid solid labor market conditions.
- Gold price is declining towards the upward-sloping trendline plotted at $1,885.77.
The pair currently trades last at 1991.53.
The previous day high was 2021.5 while the previous day low was 2000.93. The daily 38.2% Fib levels comes at 2008.79, expected to provide resistance. Similarly, the daily 61.8% fib level is at 2013.64, expected to provide resistance.
Gold price (XAU/USD) has extended its downside to near $1,990.00 as the US Dollar Index (DXY) has refreshed the day’s high amid soaring anxiety among the market participants ahead of the release of the United States inflation data. The USD Index has printed a fresh high of 102.23 as investors are anticipating a rebound in US inflation figures amid solid labor market conditions.
Meanwhile, S&P500 futures have extended their losses on hopes that the Federal Reserve (Fed) is looking to hike rates further to arrest persistent inflation, portraying a decline in the risk appetite of the market participants. Fed chair Jerome Powell is expected to push rates above 5% as the Unemployment Rate has further dropped. This might continue to force firms to offer higher earnings for acquiring fresh talent.
Contrary to the USD Index, the US Treasury yields have faced pressure. The 10-year US Treasury yields have dropped to near 3.37%.
For further guidance, Wednesday’s US inflation data will be keenly watched. Moderation in the headline Consumer Price Index (CPI) is highly expected as gas prices remained lower in March due to weak oil prices. The core inflation that excludes oil and gas prices is expected to show a surprise upside as average earnings by households are highly solid.
Gold price is declining towards the upward-sloping trendline plotted from March 15 low at $1,885.77 on an hourly scale. The precious metal has surrendered the psychological support of $2,000.00.
A bear cross, represented by the 20-and 50-period Exponential Moving Averages (EMAs) at $2,011.43, indicates more weakness ahead.
Meanwhile, the Relative Strength Index (RSI) (14) has slipped into the bearish range of 20.00-40.00, which conveys that the downside momentum is in action.
Technical Levels: Supports and Resistances
XAUUSD currently trading at 1990.36 at the time of writing. Pair opened at 2007.82 and is trading with a change of -0.87 % .
| Overview | Overview.1 | |
|---|---|---|
| 0 | Today last price | 1990.36 |
| 1 | Today Daily Change | -17.46 |
| 2 | Today Daily Change % | -0.87 |
| 3 | Today daily open | 2007.82 |
The pair remains strongly bullish on the daily timeframe. It trades above its 20 SMA @ 1962.7, 50 SMA 1898.83, 100 SMA @ 1862.26 and 200 SMA @ 1787.74.
| Trends | Trends.1 | |
|---|---|---|
| 0 | Daily SMA20 | 1962.70 |
| 1 | Daily SMA50 | 1898.83 |
| 2 | Daily SMA100 | 1862.26 |
| 3 | Daily SMA200 | 1787.74 |
The previous day high was 2021.5 while the previous day low was 2000.93. The daily 38.2% Fib levels comes at 2008.79, expected to provide resistance. Similarly, the daily 61.8% fib level is at 2013.64, expected to provide resistance.
Note the levels of interest below:
- Pivot support is noted at 1998.67, 1989.51, 1978.1
- Pivot resistance is noted at 2019.24, 2030.65, 2039.81
| Levels | Levels.1 |
|---|---|
| Previous Daily High | 2021.50 |
| Previous Daily Low | 2000.93 |
| Previous Weekly High | 2032.11 |
| Previous Weekly Low | 1949.83 |
| Previous Monthly High | 2009.88 |
| Previous Monthly Low | 1809.46 |
| Daily Fibonacci 38.2% | 2008.79 |
| Daily Fibonacci 61.8% | 2013.64 |
| Daily Pivot Point S1 | 1998.67 |
| Daily Pivot Point S2 | 1989.51 |
| Daily Pivot Point S3 | 1978.10 |
| Daily Pivot Point R1 | 2019.24 |
| Daily Pivot Point R2 | 2030.65 |
| Daily Pivot Point R3 | 2039.81 |
[/s2If]
Join Our Telegram Group


