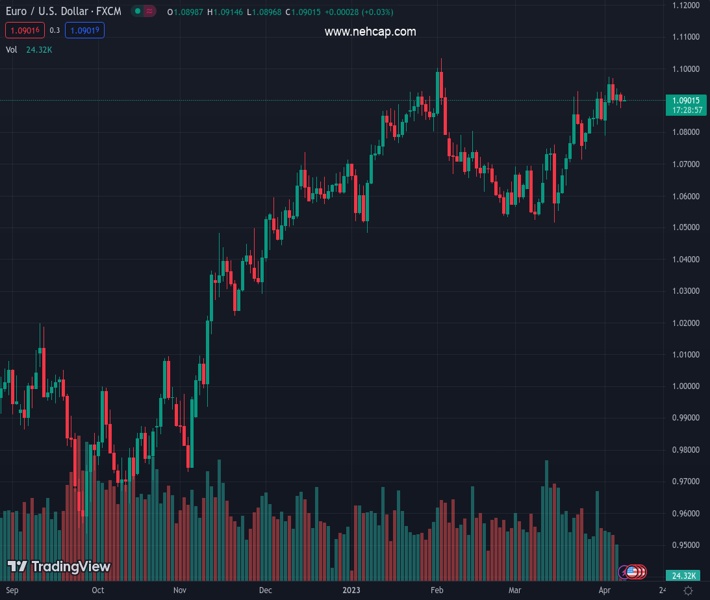
#EURUSD @ 1.09013 has slipped below 1.0900 amid a risk-off market mood due to geopolitical tensions. (Pivot Orderbook analysis)
…
This is a premium post.
[s2If !current_user_can(access_s2member_level4)]Please register for PREMIUM VERSION HERE to read full post below containing analysis. In case of any error or you think you are not able to read the full post below, please email us at support#nehcap.com [lwa][/s2If] [s2If current_user_can(access_s2member_level4)]
- EUR/USD has slipped below 1.0900 amid a risk-off market mood due to geopolitical tensions.
- Mounting expectations for a higher US core CPI are supporting the USD Index.
- Contracting Eurozone Retail Sales would be insufficient to back a neutral stance for the upcoming ECB monetary policy meeting.
The pair currently trades last at 1.09013.
The previous day high was 1.0924 while the previous day low was 1.0876. The daily 38.2% Fib levels comes at 1.0895, expected to provide support. Similarly, the daily 61.8% fib level is at 1.0906, expected to provide resistance.
The EUR/USD pair has surrendered the round-level support of 1.0900 in the Asian session. The major currency pair has attracted significant offers as investors are getting anxious ahead of the release of the United States Inflation data. The release of the US inflation is expected to provide clear guidance about interest rates from the Federal Reserve (Fed).
S&P500 futures have shifted into a negative trajectory amid geopolitical tensions. Grudges between China and Taiwan have deepened further and the Chinese military has enforced 58 aircrafts surrounding Taiwan Island, as reported by the Taiwan ministry. A weak appetite for risk-perceived assets is indicating a risk aversion theme in the current scenario.
The US Dollar Index (DXY) has refreshed its day’s high at 102.21 as investors’ expectations are highly skewed toward hawkish Fed policy. As per the CME Fedwatch tool, 66% of bets are in favor of a 25 basis point (bp) rate hike from Fed chair Jerome Powell.
Going forward, Wednesday’s US Inflation data will be keenly watched. Headline inflation is expected to see further softening as oil prices have remained lower in March, however, the core Consumer Price Index (CPI) that strips off of oil and food prices would rebound amid higher labor cost index data. Tight labor market conditions in the US economy left no other option for firms other than offering higher payouts to retain talent. Therefore, households were handed higher funds for disposal.
On the Eurozone front, Retail Sales data will be keenly watched. Monthly Retail Sales (March) are expected to contract by 0.8% vs. an expansion of 0.3% recorded in February. And annual Retail Sales would contract further to 3.5% from a prior contraction of 2.3%.
This might delight the European Central Bank (ECB) but is not sufficient to back a neutral stance for THE upcoming monetary policy meeting.
Technical Levels: Supports and Resistances
EURUSD currently trading at 1.0899 at the time of writing. Pair opened at 1.0904 and is trading with a change of -0.05 % .
| Overview | Overview.1 | |
|---|---|---|
| 0 | Today last price | 1.0899 |
| 1 | Today Daily Change | -0.0005 |
| 2 | Today Daily Change % | -0.0500 |
| 3 | Today daily open | 1.0904 |
The pair remains strongly bullish on the daily timeframe. It trades above its 20 SMA @ 1.0803, 50 SMA 1.0735, 100 SMA @ 1.0679 and 200 SMA @ 1.0352.
| Trends | Trends.1 | |
|---|---|---|
| 0 | Daily SMA20 | 1.0803 |
| 1 | Daily SMA50 | 1.0735 |
| 2 | Daily SMA100 | 1.0679 |
| 3 | Daily SMA200 | 1.0352 |
The previous day high was 1.0924 while the previous day low was 1.0876. The daily 38.2% Fib levels comes at 1.0895, expected to provide support. Similarly, the daily 61.8% fib level is at 1.0906, expected to provide resistance.
Note the levels of interest below:
- Pivot support is noted at 1.0879, 1.0854, 1.0831
- Pivot resistance is noted at 1.0927, 1.0949, 1.0975
| Levels | Levels.1 |
|---|---|
| Previous Daily High | 1.0924 |
| Previous Daily Low | 1.0876 |
| Previous Weekly High | 1.0973 |
| Previous Weekly Low | 1.0788 |
| Previous Monthly High | 1.0930 |
| Previous Monthly Low | 1.0516 |
| Daily Fibonacci 38.2% | 1.0895 |
| Daily Fibonacci 61.8% | 1.0906 |
| Daily Pivot Point S1 | 1.0879 |
| Daily Pivot Point S2 | 1.0854 |
| Daily Pivot Point S3 | 1.0831 |
| Daily Pivot Point R1 | 1.0927 |
| Daily Pivot Point R2 | 1.0949 |
| Daily Pivot Point R3 | 1.0975 |
[/s2If]
Join Our Telegram Group


