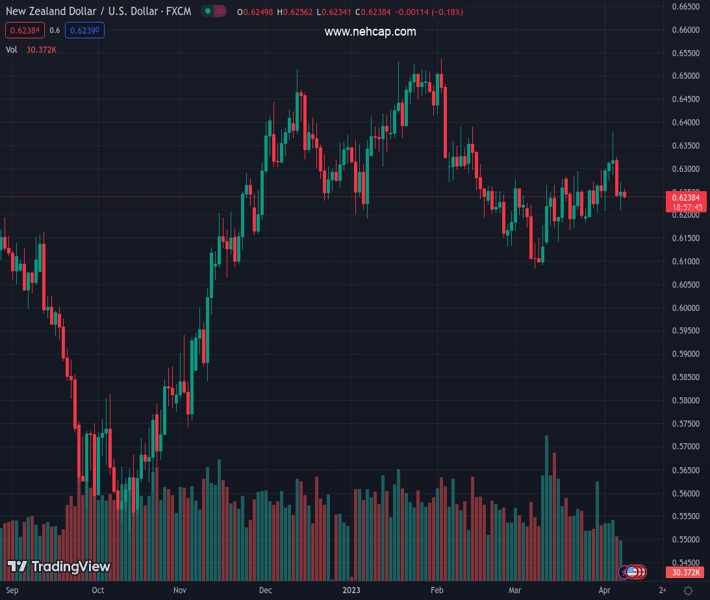
#NZDUSD @ 0.62399 renews intraday low, extends previous week’s pullback from two-month high., @nehcap view: Further downside expected (Pivot Orderbook analysis)
…
This is a premium post.
[s2If !current_user_can(access_s2member_level4)]Please register for PREMIUM VERSION HERE to read full post below containing analysis. In case of any error or you think you are not able to read the full post below, please email us at support#nehcap.com [lwa][/s2If] [s2If current_user_can(access_s2member_level4)]
- NZD/USD renews intraday low, extends previous week’s pullback from two-month high.
- Successful break of one-month-old ascending trend line, clear U-turn from 0.6385-90 resistance confluence favor sellers.
- Looming bear cross on MACD, steady RSI (14) adds strength to downside bias.
The pair currently trades last at 0.62399.
The previous day high was 0.6389 while the previous day low was 0.6209. The daily 38.2% Fib levels comes at 0.632, expected to provide resistance. Similarly, the daily 61.8% fib level is at 0.6278, expected to provide resistance.
NZD/USD takes offers to refresh intraday low near 0.6240 during early Monday. In doing so, the Kiwi pair defends the previous week’s downward trajectory from a two-month high while breaking an upward-sloping support line from March, now immediate resistance, amid the Easter Monday holiday.
Not only the trend line break but a U-turn from the two-month-old horizontal resistance area and bearish MACD signals, as well as the steady RSI (14) line, also favor the NZD/USD sellers.
With this, the Kiwi pair is all set to attack the 0.6200 round figure. However, the 200-DMA hurdle of around 0.6160 can challenge the bears afterward.
Following that, the Year-To-Date (YTD) low marked in March around 0.6080 and the 0.6000 psychological magnet can lure the NZD/USD sellers during the pair’s further downside.
On the contrary, recovery moves need to cross the support-turned-resistance line, around 0.6260 at the latest, to convince intraday buyers of the NZD/USD pair.
Even so, the 50% and 61.8% Fibonacci retracement level of the pair’s February-March fall, around 0.6310 and 0.6365 in that order, can challenge the bulls.
It’s worth noting that the NZD/USD upside remains elusive unless the quote stays successfully beyond the two-month-old horizontal resistance area surrounding 0.6385-90.
Trend: Further downside expected
Technical Levels: Supports and Resistances
NZDUSD currently trading at 0.624 at the time of writing. Pair opened at 0.6268 and is trading with a change of -0.45% % .
| Overview | Overview.1 | |
|---|---|---|
| 0 | Today last price | 0.624 |
| 1 | Today Daily Change | -0.0028 |
| 2 | Today Daily Change % | -0.45% |
| 3 | Today daily open | 0.6268 |
The pair is trading below its 20 Daily moving average @ 0.6243, below its 50 Daily moving average @ 0.6259 , below its 100 Daily moving average @ 0.6302 and above its 200 Daily moving average @ 0.616
| Trends | Trends.1 | |
|---|---|---|
| 0 | Daily SMA20 | 0.6243 |
| 1 | Daily SMA50 | 0.6259 |
| 2 | Daily SMA100 | 0.6302 |
| 3 | Daily SMA200 | 0.6160 |
The previous day high was 0.6389 while the previous day low was 0.6209. The daily 38.2% Fib levels comes at 0.632, expected to provide resistance. Similarly, the daily 61.8% fib level is at 0.6278, expected to provide resistance.
Note the levels of interest below:
- Pivot support is noted at 0.6188, 0.6108, 0.6008
- Pivot resistance is noted at 0.6369, 0.6469, 0.6549
| Levels | Levels.1 |
|---|---|
| Previous Daily High | 0.6389 |
| Previous Daily Low | 0.6209 |
| Previous Weekly High | 0.6389 |
| Previous Weekly Low | 0.6207 |
| Previous Monthly High | 0.6298 |
| Previous Monthly Low | 0.6084 |
| Daily Fibonacci 38.2% | 0.6320 |
| Daily Fibonacci 61.8% | 0.6278 |
| Daily Pivot Point S1 | 0.6188 |
| Daily Pivot Point S2 | 0.6108 |
| Daily Pivot Point S3 | 0.6008 |
| Daily Pivot Point R1 | 0.6369 |
| Daily Pivot Point R2 | 0.6469 |
| Daily Pivot Point R3 | 0.6549 |
[/s2If]
Join Our Telegram Group


