#AUDUSD @ 0.66675 struggles for directions after reversing from six-week high., @nehcap view: Further downside expected (Pivot Orderbook analysis)
…
This is a premium post.
[s2If !current_user_can(access_s2member_level4)]Please register for PREMIUM VERSION HERE to read full post below containing analysis. In case of any error or you think you are not able to read the full post below, please email us at support#nehcap.com [lwa][/s2If] [s2If current_user_can(access_s2member_level4)]
- AUD/USD struggles for directions after reversing from six-week high.
- Below 50 RSI (14), receding bearish bias of MACD signals favor corrective bounce off the key Fibonacci retracement.
- Clear downside break of one-month-old ascending trend line keeps sellers hopeful.
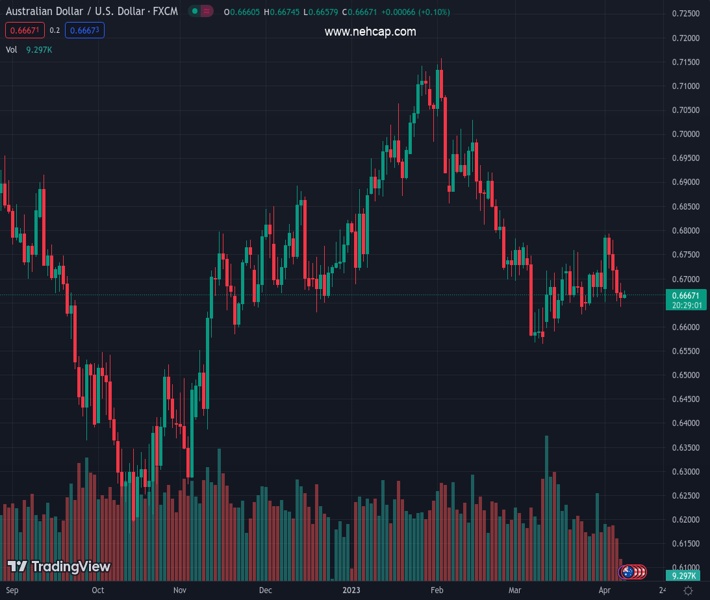
The pair currently trades last at 0.66675.
The previous day high was 0.6691 while the previous day low was 0.6641. The daily 38.2% Fib levels comes at 0.6672, expected to provide resistance. Similarly, the daily 61.8% fib level is at 0.666, expected to provide support.
AUD/USD seesaws around 0.6670 as it seeks fresh clues to extend the previous day’s rebound from the 61.8% Fibonacci retracement level of its March-April upside.
Even if the Aussie pair struggles to extend the previous day’s recovery from the key Fibonacci retracement, also known as the “golden ratio”, a sustained downside break of the one-month-old ascending trend line, now immediate resistance near 0.6690, keeps bears hopeful.
Also challenging the AUD/USD buyers is the recently easing RSI (14) line, suggesting dip-buying, as well as the improving MACD line from the bearish territory.
It’s worth noting, however, that an upside break of the support-turned-resistance line of near 0.6690 isn’t an open invitation to the AUD/USD bulls as a convergence of the 50-SMA and 38.2% Fibonacci retracement level, around 0.6705, appears a tough nut to crack for the bulls.
Following that, a 13-day-old horizontal area near 0.6760 could challenge the upside momentum near 0.6755-60.
On the flip side, the 61.8% Fibonacci retracement level of around 0.6650 acts as a short-term key support to watch during the AUD/USD pair’s fresh downside.
In a case where the Aussie pair remains bearish past 0.6650, multiple levels near 0.6630 can test the sellers before directing them to the previous monthly low of near 0.6560.
Trend: Further downside expected
Technical Levels: Supports and Resistances
AUDUSD currently trading at 0.6673 at the time of writing. Pair opened at 0.6674 and is trading with a change of -0.01% % .
| Overview | Overview.1 | |
|---|---|---|
| 0 | Today last price | 0.6673 |
| 1 | Today Daily Change | -0.0001 |
| 2 | Today Daily Change % | -0.01% |
| 3 | Today daily open | 0.6674 |
The pair remains strongly bearish on the daily time frame. It trades below the 20 SMA @ 0.6688, 50 SMA 0.6784, 100 SMA @ 0.68 and 200 SMA @ 0.6748.
| Trends | Trends.1 | |
|---|---|---|
| 0 | Daily SMA20 | 0.6688 |
| 1 | Daily SMA50 | 0.6784 |
| 2 | Daily SMA100 | 0.6800 |
| 3 | Daily SMA200 | 0.6748 |
The previous day high was 0.6691 while the previous day low was 0.6641. The daily 38.2% Fib levels comes at 0.6672, expected to provide resistance. Similarly, the daily 61.8% fib level is at 0.666, expected to provide support.
Note the levels of interest below:
- Pivot support is noted at 0.6646, 0.6618, 0.6596
- Pivot resistance is noted at 0.6696, 0.6719, 0.6746
| Levels | Levels.1 |
|---|---|
| Previous Daily High | 0.6691 |
| Previous Daily Low | 0.6641 |
| Previous Weekly High | 0.6793 |
| Previous Weekly Low | 0.6641 |
| Previous Monthly High | 0.6784 |
| Previous Monthly Low | 0.6564 |
| Daily Fibonacci 38.2% | 0.6672 |
| Daily Fibonacci 61.8% | 0.6660 |
| Daily Pivot Point S1 | 0.6646 |
| Daily Pivot Point S2 | 0.6618 |
| Daily Pivot Point S3 | 0.6596 |
| Daily Pivot Point R1 | 0.6696 |
| Daily Pivot Point R2 | 0.6719 |
| Daily Pivot Point R3 | 0.6746 |
[/s2If]
Join Our Telegram Group


