#XAGUSD @ 24.925 Silver price portrays a bullish chart pattern at the highest level in a year, retreats of late., @nehcap view: Further upside expected (Pivot Orderbook analysis)
…
This is a premium post.
[s2If !current_user_can(access_s2member_level4)]Please register for PREMIUM VERSION HERE to read full post below containing analysis. In case of any error or you think you are not able to read the full post below, please email us at support#nehcap.com [lwa][/s2If] [s2If current_user_can(access_s2member_level4)]
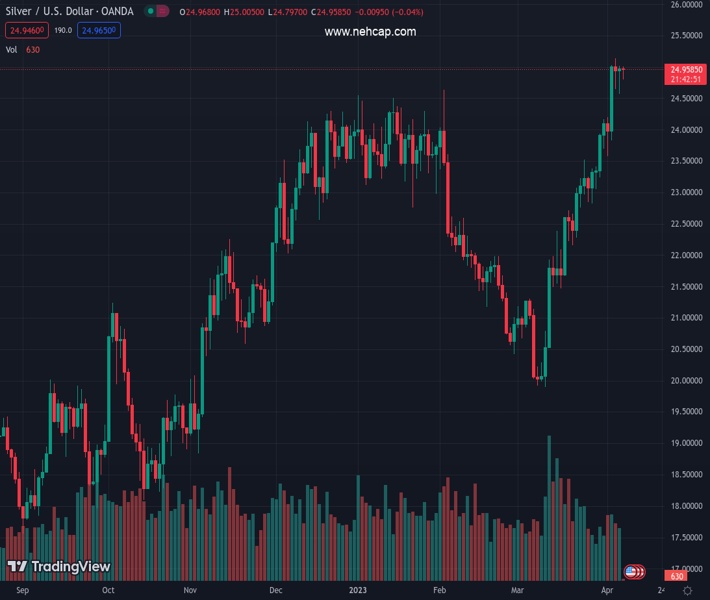
- Silver price portrays a bullish chart pattern at the highest level in a year, retreats of late.
- Sustained trading beyond 200-HMA, steady RSI keeps XAG/USD buyers hopeful.
- Sellers stay off the table beyond $24.60, bulls may cross $26.00 on sustained upside beyond $25.00.
The pair currently trades last at 24.925.
The previous day high was 25.0 while the previous day low was 24.56. The daily 38.2% Fib levels comes at 24.84, expected to provide support. Similarly, the daily 61.8% fib level is at 24.73, expected to provide support.
Silver price (XAG/USD) prints mild losses near $25.00 as bulls take a breather during a sluggish start of the week, mainly due to the Easter Monday holiday, after four-week uptrend. Even so, the bright metal portrays a “Bull Flag” chart pattern on the hourly play and keeps the buyers hopeful.
Adding strength to the upside bias is the absence of an overbought RSI (14), as well as the metal’s sustained trading past the 200-Hour Moving Average (HMA).
It’s worth noting, however, that the bulls need a successful break of the $25.00 round figure to confirm the bullish chart pattern, which in turn suggests, theoretically, a run-up toward $26.20.
However, April 2022 high near $26.25 and the previous yearly top surrounding $27.00 could challenge the Silver buyers afterward.
On the contrary, the XAG/USD weakness past the stated flag’s lower line, around $24.50 by the press time, defies the bullish chart pattern.
Though, the Silver bears still will have a long road to journey before retaking control as a two-week-old ascending support line and the 200-HMA, respectively near $24.30 and the $24.00 round figure, could challenge the downside moves.
Trend: Further upside expected
Technical Levels: Supports and Resistances
XAGUSD currently trading at 24.98 at the time of writing. Pair opened at 24.97 and is trading with a change of 0.04% % .
| Overview | Overview.1 | |
|---|---|---|
| 0 | Today last price | 24.98 |
| 1 | Today Daily Change | 0.01 |
| 2 | Today Daily Change % | 0.04% |
| 3 | Today daily open | 24.97 |
The pair remains strongly bullish on the daily timeframe. It trades above its 20 SMA @ 23.05, 50 SMA 22.29, 100 SMA @ 22.72 and 200 SMA @ 21.11.
| Trends | Trends.1 | |
|---|---|---|
| 0 | Daily SMA20 | 23.05 |
| 1 | Daily SMA50 | 22.29 |
| 2 | Daily SMA100 | 22.72 |
| 3 | Daily SMA200 | 21.11 |
The previous day high was 25.0 while the previous day low was 24.56. The daily 38.2% Fib levels comes at 24.84, expected to provide support. Similarly, the daily 61.8% fib level is at 24.73, expected to provide support.
Note the levels of interest below:
- Pivot support is noted at 24.69, 24.41, 24.25
- Pivot resistance is noted at 25.13, 25.29, 25.57
| Levels | Levels.1 |
|---|---|
| Previous Daily High | 25.00 |
| Previous Daily Low | 24.56 |
| Previous Weekly High | 25.14 |
| Previous Weekly Low | 23.57 |
| Previous Monthly High | 24.16 |
| Previous Monthly Low | 19.90 |
| Daily Fibonacci 38.2% | 24.84 |
| Daily Fibonacci 61.8% | 24.73 |
| Daily Pivot Point S1 | 24.69 |
| Daily Pivot Point S2 | 24.41 |
| Daily Pivot Point S3 | 24.25 |
| Daily Pivot Point R1 | 25.13 |
| Daily Pivot Point R2 | 25.29 |
| Daily Pivot Point R3 | 25.57 |
[/s2If]
Join Our Telegram Group


