#GBPUSD @ 1.24130 is struggling in expecting its recovery above 1.2430 amid China-Taiwan tensions. (Pivot Orderbook analysis)
…
This is a premium post.
[s2If !current_user_can(access_s2member_level4)]Please register for PREMIUM VERSION HERE to read full post below containing analysis. In case of any error or you think you are not able to read the full post below, please email us at support#nehcap.com [lwa][/s2If] [s2If current_user_can(access_s2member_level4)]
- GBP/USD is struggling in expecting its recovery above 1.2430 amid China-Taiwan tensions.
- The US Dollar Index (DXY) is putting efforts into defending its crucial support of 102.00 after a marginal correction.
- GBP/USD is expected to extend its correction to near the lower portion of the Rising Channel chart pattern.
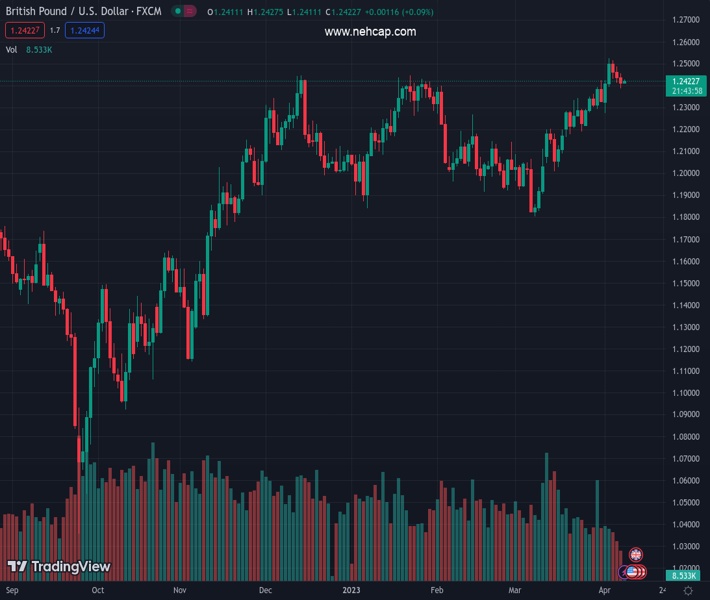
The pair currently trades last at 1.24130.
The previous day high was 1.2456 while the previous day low was 1.2389. The daily 38.2% Fib levels comes at 1.2415, expected to provide resistance. Similarly, the daily 61.8% fib level is at 1.243, expected to provide resistance.
The GBP/USD pair is hovering below 1.2430 after a recovery move from the round-level support of 1.2400 in the early Asian session. Expectations for a corrective move in the Cable look healthy as China-Taiwan tensions are deepening further. On late Sunday, the Taiwan Defence Ministry reported that they spotted 58 Chinese aircrafts, which also includes nine ships. Meanwhile, State Media reported that the Chinese military told about keeping the momentum of drilling around Taiwan Island.
The US Dollar Index (DXY) is putting efforts into defending its crucial support of 102.00 after a marginal correction. It is likely that geopolitical tensions would provide some support to the USD Index. The USD Index is likely to remain in action ahead of the release of the United States Consumer Price Index (CPI) data, which will release on Wednesday. Headline inflation is expected to soften further as oil prices remained weak in March, however, core inflation might accelerate as anticipated.
S&P500 futures are showing some gains in the early Asian session, indicating some strength in equities ahead of earnings season.
On a two-hour scale, GBP/USD is expected to extend its correction to near the lower portion of the Rising Channel chart pattern. The 20-period Exponential Moving Average (EMA) at 1.2436 is restricting upside attempts from the Pound Sterling.
Meanwhile, the Relative Strength Index (RSI) (14) is defending its downside around 40.00. A break below the same would trigger the bearish momentum.
For a downside move, the Cable needs to deliver a breakdown of the Rising Channel pattern below March 23 high at 1.2343, which will expose the asset to the round-level support of 1.2300 followed by March 14 high around 1.2200.
Alternatively, a decisive move above Friday’s high at 1.2453 will drive the asset towards April 04 high at 1.2525. A break above the latter would further drive the Cable toward the round-level resistance at 1.2600.
Technical Levels: Supports and Resistances
GBPUSD currently trading at 1.2428 at the time of writing. Pair opened at 1.2418 and is trading with a change of 0.08 % .
| Overview | Overview.1 | |
|---|---|---|
| 0 | Today last price | 1.2428 |
| 1 | Today Daily Change | 0.0010 |
| 2 | Today Daily Change % | 0.0800 |
| 3 | Today daily open | 1.2418 |
The pair remains strongly bullish on the daily timeframe. It trades above its 20 SMA @ 1.2293, 50 SMA 1.2156, 100 SMA @ 1.2159 and 200 SMA @ 1.1902.
| Trends | Trends.1 | |
|---|---|---|
| 0 | Daily SMA20 | 1.2293 |
| 1 | Daily SMA50 | 1.2156 |
| 2 | Daily SMA100 | 1.2159 |
| 3 | Daily SMA200 | 1.1902 |
The previous day high was 1.2456 while the previous day low was 1.2389. The daily 38.2% Fib levels comes at 1.2415, expected to provide resistance. Similarly, the daily 61.8% fib level is at 1.243, expected to provide resistance.
Note the levels of interest below:
- Pivot support is noted at 1.2386, 1.2354, 1.2319
- Pivot resistance is noted at 1.2453, 1.2488, 1.252
| Levels | Levels.1 |
|---|---|
| Previous Daily High | 1.2456 |
| Previous Daily Low | 1.2389 |
| Previous Weekly High | 1.2525 |
| Previous Weekly Low | 1.2275 |
| Previous Monthly High | 1.2424 |
| Previous Monthly Low | 1.1803 |
| Daily Fibonacci 38.2% | 1.2415 |
| Daily Fibonacci 61.8% | 1.2430 |
| Daily Pivot Point S1 | 1.2386 |
| Daily Pivot Point S2 | 1.2354 |
| Daily Pivot Point S3 | 1.2319 |
| Daily Pivot Point R1 | 1.2453 |
| Daily Pivot Point R2 | 1.2488 |
| Daily Pivot Point R3 | 1.2520 |
[/s2If]
Join Our Telegram Group


