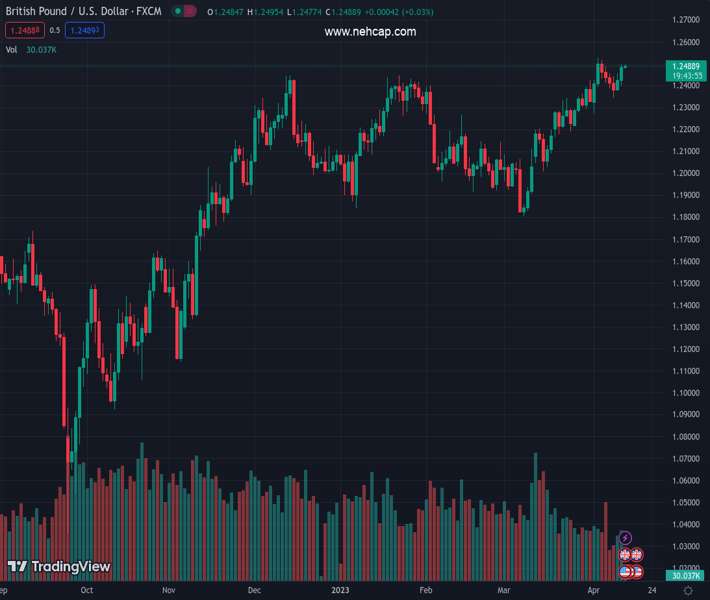
#GBPUSD @ 1.24465 treads water after reversing from 10-month high., @nehcap view: Further upside expected (Pivot Orderbook analysis)
…
This is a premium post.
[s2If !current_user_can(access_s2member_level4)]Please register for PREMIUM VERSION HERE to read full post below containing analysis. In case of any error or you think you are not able to read the full post below, please email us at support#nehcap.com [lwa][/s2If] [s2If current_user_can(access_s2member_level4)]
- GBP/USD treads water after reversing from 10-month high.
- Previously key horizontal resistance, bullish MACD signals favor Cable buyers.
- Three-week-old ascending trend line acts as additional downside filter.
- Multiple resistances to test GBP/USD bulls during recovery, offering a bumpy ride ahead.
The pair currently trades last at 1.24465.
The previous day high was 1.2514 while the previous day low was 1.2433. The daily 38.2% Fib levels comes at 1.2464, expected to provide resistance. Similarly, the daily 61.8% fib level is at 1.2483, expected to provide resistance.
GBP/USD struggles for clear directions as it makes rounds to 1.2460-55 during the mid-Asian session on Thursday.
The Cable pair reversed from its highest levels since June 2022 the previous day to print the first daily loss in three amid an overbought RSI (14). However, a four-month-old previous resistance line joins the bullish MACD signals to challenge the GBP/USD bears of late.
Even if the quote drops below the resistance-turned-support surrounding 1.2450-45, an upward-sloping support line from mid-March, around 1.2410, can act as the last defense of the GBP/USD buyers.
Following that, February 14 swing high around 1.2270 may prod the GBP/USD bears before directing them to the Year-To-Date low marked in March around 1.1800.
Alternatively, recovery moves need to cross the latest peak of 1.2525 to convince the Cable buyers to return to the table.
Following that, the 61.8% Fibonacci Expansion (FE) of its moves between November 2022 and March 2023, close to 1.2605, may challenge the GBP/USD bulls.
In a case where the pair remains firmer past 1.2605, the May 2022 high of around 1.2665-70 can challenge the upside momentum.
Overall, GBP/USD remains on the bull’s even if it trades sluggishly of late.
Trend: Further upside expected
Technical Levels: Supports and Resistances
GBPUSD currently trading at 1.2463 at the time of writing. Pair opened at 1.2462 and is trading with a change of 0.01% % .
| Overview | Overview.1 | |
|---|---|---|
| 0 | Today last price | 1.2463 |
| 1 | Today Daily Change | 0.0001 |
| 2 | Today Daily Change % | 0.01% |
| 3 | Today daily open | 1.2462 |
The pair remains strongly bullish on the daily timeframe. It trades above its 20 SMA @ 1.2248, 50 SMA 1.2155, 100 SMA @ 1.2148 and 200 SMA @ 1.1899.
| Trends | Trends.1 | |
|---|---|---|
| 0 | Daily SMA20 | 1.2248 |
| 1 | Daily SMA50 | 1.2155 |
| 2 | Daily SMA100 | 1.2148 |
| 3 | Daily SMA200 | 1.1899 |
The previous day high was 1.2514 while the previous day low was 1.2433. The daily 38.2% Fib levels comes at 1.2464, expected to provide resistance. Similarly, the daily 61.8% fib level is at 1.2483, expected to provide resistance.
Note the levels of interest below:
- Pivot support is noted at 1.2425, 1.2388, 1.2344
- Pivot resistance is noted at 1.2506, 1.2551, 1.2588
| Levels | Levels.1 |
|---|---|
| Previous Daily High | 1.2514 |
| Previous Daily Low | 1.2433 |
| Previous Weekly High | 1.2424 |
| Previous Weekly Low | 1.2219 |
| Previous Monthly High | 1.2424 |
| Previous Monthly Low | 1.1803 |
| Daily Fibonacci 38.2% | 1.2464 |
| Daily Fibonacci 61.8% | 1.2483 |
| Daily Pivot Point S1 | 1.2425 |
| Daily Pivot Point S2 | 1.2388 |
| Daily Pivot Point S3 | 1.2344 |
| Daily Pivot Point R1 | 1.2506 |
| Daily Pivot Point R2 | 1.2551 |
| Daily Pivot Point R3 | 1.2588 |
[/s2If]
Join Our Telegram Group


