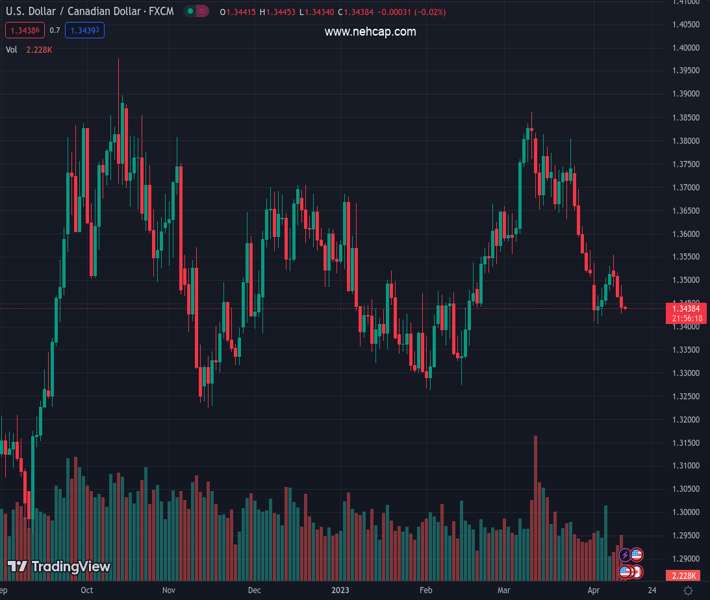
#USDCAD @ 1.34539 has locked in a tight range ahead of the US/Canada labor market data. (Pivot Orderbook analysis)
…
This is a premium post.
[s2If !current_user_can(access_s2member_level4)]Please register for PREMIUM VERSION HERE to read full post below containing analysis. In case of any error or you think you are not able to read the full post below, please email us at support#nehcap.com [lwa][/s2If] [s2If current_user_can(access_s2member_level4)]
- USD/CAD has locked in a tight range ahead of the US/Canada labor market data.
- The tight US labor market is cooling down as firms have eased their recruitment process.
- Canada’s Employment Change is seen at 12K and the Unemployment Rate might escalate to 5.1%.
The pair currently trades last at 1.34539.
The previous day high was 1.3467 while the previous day low was 1.3406. The daily 38.2% Fib levels comes at 1.3444, expected to provide support. Similarly, the daily 61.8% fib level is at 1.3429, expected to provide support.
The USD/CAD pair corrected below 1.3450 in the early Asian session as the US Dollar Index (DXY) showed a loss in the upside momentum after reaching to the critical resistance of 102.00. The Loonie asset is expected to deliver a power-pack action as investors are awaiting the release of the United States/Canada Employment data.
The tight US labor market is cooling down as firms have eased their recruitment process observed after a slowdown in Job Openings and weak additions of fresh jobs through Automatic Data Processing (ADP). This has triggered expectations of steady interest rates by the Federal Reserve (Fed) for its May policy meeting.
Meanwhile, S&P500 futures have resumed their downside journey, conveying a risk-off market mood.
The Canadian Dollar will be impacted by the Employment data. As per the consensus, Net Change in Employment is seen at 12K, lower than the former release of 21.8K. The Unemployment Rate is seen higher at 5.1% vs. the former release of 5.0%.
USD/CAD is auctioning in an Inverted Flag chart pattern on an hourly scale. An Inverted Flag is a trend-following pattern that displays a long consolidation that is followed by a breakdown. Usually, the consolidation phase of the chart pattern serves as an inventory adjustment in which those participants initiate shorts, which prefer to enter an auction after the establishment of a bearish bias and current sellers add more positions.
The Loonie asset has failed to sustain above the 50-period Exponential Moving Average (EMA) at 1.3458, which indicates more weakness ahead.
Meanwhile, the upside in the Relative Strength Index (RSI) (14) is capped around 60.00. A slippage into the bearish range of 20.00-40.00 will activate the downside momentum.
A downside break below April 04 low at 1.3406 will expose the asset to a fresh six-week low near 1.3350, which is February 6 low followed by the round-level support at 1.3300.
In an alternate scenario, an upside move above the psychological resistance of 1.3500 will shift traction in the favor of US Dollar bulls, which will drive the asset toward March 31 high and March 29 high at 1.3559 and 1.3619 respectively.
Technical Levels: Supports and Resistances
USDCAD currently trading at 1.3452 at the time of writing. Pair opened at 1.3445 and is trading with a change of 0.05 % .
| Overview | Overview.1 | |
|---|---|---|
| 0 | Today last price | 1.3452 |
| 1 | Today Daily Change | 0.0007 |
| 2 | Today Daily Change % | 0.0500 |
| 3 | Today daily open | 1.3445 |
The pair is trading below its 20 Daily moving average @ 1.367, below its 50 Daily moving average @ 1.3546 , below its 100 Daily moving average @ 1.3524 and above its 200 Daily moving average @ 1.3381
| Trends | Trends.1 | |
|---|---|---|
| 0 | Daily SMA20 | 1.3670 |
| 1 | Daily SMA50 | 1.3546 |
| 2 | Daily SMA100 | 1.3524 |
| 3 | Daily SMA200 | 1.3381 |
The previous day high was 1.3467 while the previous day low was 1.3406. The daily 38.2% Fib levels comes at 1.3444, expected to provide support. Similarly, the daily 61.8% fib level is at 1.3429, expected to provide support.
Note the levels of interest below:
- Pivot support is noted at 1.3411, 1.3378, 1.335
- Pivot resistance is noted at 1.3473, 1.3501, 1.3535
| Levels | Levels.1 |
|---|---|
| Previous Daily High | 1.3467 |
| Previous Daily Low | 1.3406 |
| Previous Weekly High | 1.3745 |
| Previous Weekly Low | 1.3508 |
| Previous Monthly High | 1.3862 |
| Previous Monthly Low | 1.3508 |
| Daily Fibonacci 38.2% | 1.3444 |
| Daily Fibonacci 61.8% | 1.3429 |
| Daily Pivot Point S1 | 1.3411 |
| Daily Pivot Point S2 | 1.3378 |
| Daily Pivot Point S3 | 1.3350 |
| Daily Pivot Point R1 | 1.3473 |
| Daily Pivot Point R2 | 1.3501 |
| Daily Pivot Point R3 | 1.3535 |
[/s2If]
Join Our Telegram Group


