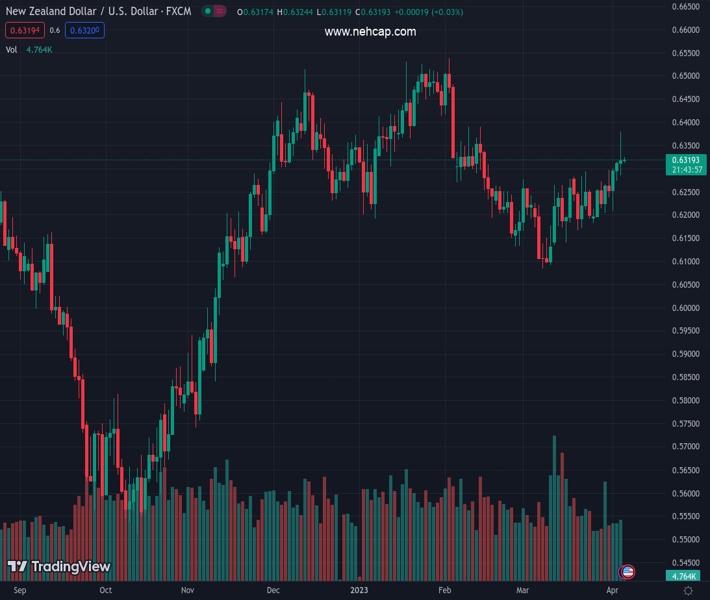
#NZDUSD @ 0.63216 is looking to seize back the 0.6350 resistance as RBNZ-Fed policy divergence expands. (Pivot Orderbook analysis)
…
This is a premium post.
[s2If !current_user_can(access_s2member_level4)]Please register for PREMIUM VERSION HERE to read full post below containing analysis. In case of any error or you think you are not able to read the full post below, please email us at support#nehcap.com [lwa][/s2If] [s2If current_user_can(access_s2member_level4)]
- NZD/USD is looking to seize back the 0.6350 resistance as RBNZ-Fed policy divergence expands.
- RBNZ Orr hiked its OCR by 50 bps while the street was estimating a rate hike of 25 bps.
- S&P500 futures have added losses further after a two-day losing streak, portraying a further decline in the risk appetite.
The pair currently trades last at 0.63216.
The previous day high was 0.6315 while the previous day low was 0.6259. The daily 38.2% Fib levels comes at 0.6294, expected to provide support. Similarly, the daily 61.8% fib level is at 0.6281, expected to provide support.
The NZD/USD pair is aiming to recapture the critical resistance of 0.6350 as the surprise interest rate decision of 50 basis points (bps) hike by the Reserve Bank of New Zealand (RBNZ) to 5.25% has expanded the RBNZ-Federal Reserve (Fed) policy divergence.
RBNZ Governor Adrian Orr hiked its Official Cash Rate (OCR) by 50 bps on Wednesday while the street was estimating a rate hike of 25 bps. The RBNZ went for a bumper rate hike despite signs of contraction. New Zealand’s inflation rate is not softening in the past three months, therefore, big rate hikes were needed to tame price pressures dramatically.
Meanwhile, S&P500 futures have added losses further after a two-day losing streak, portraying a further decline in the risk appetite of the market participants. The US Dollar Index (DXY) has sensed a pause while attempting to surpass the critical resistance of 102.00. Going forward, the USD Index will dance to the tunes of the United States Nonfarm Payrolls (NFP) data, which will release on Friday.
On a two-hour scale, NZD/USD is auctioning in a Rising Channel chart pattern in which each corrective move is considered a buying opportunity for the market participants. The Kiwi asset attempted a breakout of the aforementioned chart pattern on Wednesday but failed to keep the strength amid the presence of responsive sellers.
The 20-period Exponential Moving Average (EMA) at 0.6312 is providing support to the New Zealand Dollar.
Meanwhile, the Relative Strength Index (RSI) (14) has slipped into the 40.00-60.00 range after exhaustion in the upside momentum.
A decisive break above February 07 high at 0.6363 will expose the Kiwi asset to the round-level resistance at 0.6400 followed by December 05 high at 0.6443.
On the flip side, a breakdown of March 21 low at 0.6167 will drag the asset toward March 15 low at 0.6139. A slippage below the latter will expose the asset for more downside toward the round-level support at 0.6100.
Technical Levels: Supports and Resistances
NZDUSD currently trading at 0.6322 at the time of writing. Pair opened at 0.6313 and is trading with a change of 0.14 % .
| Overview | Overview.1 | |
|---|---|---|
| 0 | Today last price | 0.6322 |
| 1 | Today Daily Change | 0.0009 |
| 2 | Today Daily Change % | 0.1400 |
| 3 | Today daily open | 0.6313 |
The pair remains strongly bullish on the daily timeframe. It trades above its 20 SMA @ 0.6219, 50 SMA 0.6271, 100 SMA @ 0.6298 and 200 SMA @ 0.6159.
| Trends | Trends.1 | |
|---|---|---|
| 0 | Daily SMA20 | 0.6219 |
| 1 | Daily SMA50 | 0.6271 |
| 2 | Daily SMA100 | 0.6298 |
| 3 | Daily SMA200 | 0.6159 |
The previous day high was 0.6315 while the previous day low was 0.6259. The daily 38.2% Fib levels comes at 0.6294, expected to provide support. Similarly, the daily 61.8% fib level is at 0.6281, expected to provide support.
Note the levels of interest below:
- Pivot support is noted at 0.6276, 0.624, 0.6221
- Pivot resistance is noted at 0.6332, 0.6352, 0.6388
| Levels | Levels.1 |
|---|---|
| Previous Daily High | 0.6315 |
| Previous Daily Low | 0.6259 |
| Previous Weekly High | 0.6298 |
| Previous Weekly Low | 0.6180 |
| Previous Monthly High | 0.6298 |
| Previous Monthly Low | 0.6084 |
| Daily Fibonacci 38.2% | 0.6294 |
| Daily Fibonacci 61.8% | 0.6281 |
| Daily Pivot Point S1 | 0.6276 |
| Daily Pivot Point S2 | 0.6240 |
| Daily Pivot Point S3 | 0.6221 |
| Daily Pivot Point R1 | 0.6332 |
| Daily Pivot Point R2 | 0.6352 |
| Daily Pivot Point R3 | 0.6388 |
[/s2If]
Join Our Telegram Group


