#XAUUSD @ 2,020.50 Gold price has turned sideways above $2,020.00 ahead of the US NFP data. (Pivot Orderbook analysis)
…
This is a premium post.
[s2If !current_user_can(access_s2member_level4)]Please register for PREMIUM VERSION HERE to read full post below containing analysis. In case of any error or you think you are not able to read the full post below, please email us at support#nehcap.com [lwa][/s2If] [s2If current_user_can(access_s2member_level4)]
- Gold price has turned sideways above $2,020.00 ahead of the US NFP data.
- US Services PMI defending dropping below 50.0 but recession fears get deepened.
- The Labor Cost Index data is expected to soften ahead, which might decelerate inflationary pressures further.
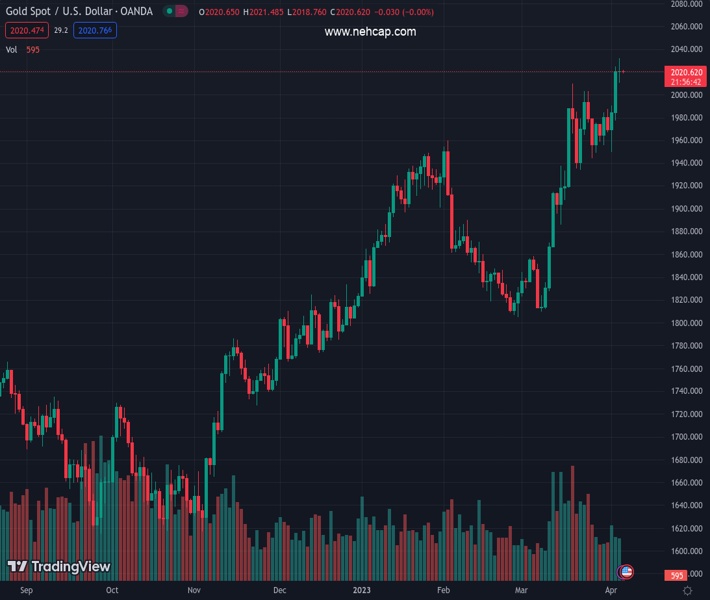
The pair currently trades last at 2020.50.
The previous day high was 2025.08 while the previous day low was 1977.03. The daily 38.2% Fib levels comes at 2006.72, expected to provide support. Similarly, the daily 61.8% fib level is at 1995.39, expected to provide support.
Gold price (XAU/USD) is showing a lackluster performance above $2,020.00 in the early Tokyo session. The precious metal witnessed a wild gyration after the release of weak United States Employment data on Wednesday. The Gold price has turned sideways as investors have shifted their focus toward the release of the US Nonfarm Payrolls (NFP) data.
S&P500 continued its downside move on Wednesday as weaker Services PMI stroked signs of recession in the US economy, indicating negative market sentiment. The US Dollar Index (DXY) rebounded firmly from its fresh monthly low of 101.40 but observed a restricted upside near 102.00. The USD Index attracted significant bids despite the release of downbeat US Services PMI and labor market data.
March’s US ISM Services PMI dropped to 51.2 vs. the consensus of 54.5 and the former release of 55.1. A slowdown in the Service sector shows deepening concerns due to higher rates by the Federal Reserve (Fed). Also, households are struggling in bearing the burden of high inflation. The New Orders Index that conveys forward-demand dropped dramatically to 52.2 from the estimates of 57.6 and the prior release of 62.6. It is quite satisfactory that the US Services PMI gamut didn’t fall below 50.0 as it would have been considered a contraction.
After the release of downbeat US Automatic Data Processing (ADP) Employment data, investors are keenly awaiting the release of US NFP, which will provide more clarity on labor market conditions. The Unemployment Rate is expected to remain steady at 3.6%. And Average Hourly Earnings would soften to 4.3% vs. the former release of 4.6%.
Gold price is oscillating in a narrow range of $2,011-2,033 on an hourly sale. The precious metal found cushion after a wild move from March 20 high at $2,009.88. The Gold price is struggling to sustain above the 20-period Exponential Moving Average (EMA) at $2,021.20. While the 50-period EMA at $2,010.00 is still advancing.
Meanwhile, the Relative Strength Index (RSI) (14) has dropped into the 40.00-60.00 range after exhaustion in the upside momentum.
Technical Levels: Supports and Resistances
XAUUSD currently trading at 2019.38 at the time of writing. Pair opened at 2020.4 and is trading with a change of -0.05 % .
| Overview | Overview.1 | |
|---|---|---|
| 0 | Today last price | 2019.38 |
| 1 | Today Daily Change | -1.02 |
| 2 | Today Daily Change % | -0.05 |
| 3 | Today daily open | 2020.40 |
The pair remains strongly bullish on the daily timeframe. It trades above its 20 SMA @ 1943.47, 50 SMA 1895.78, 100 SMA @ 1857.33 and 200 SMA @ 1785.72.
| Trends | Trends.1 | |
|---|---|---|
| 0 | Daily SMA20 | 1943.47 |
| 1 | Daily SMA50 | 1895.78 |
| 2 | Daily SMA100 | 1857.33 |
| 3 | Daily SMA200 | 1785.72 |
The previous day high was 2025.08 while the previous day low was 1977.03. The daily 38.2% Fib levels comes at 2006.72, expected to provide support. Similarly, the daily 61.8% fib level is at 1995.39, expected to provide support.
Note the levels of interest below:
- Pivot support is noted at 1989.93, 1959.45, 1941.88
- Pivot resistance is noted at 2037.98, 2055.55, 2086.03
| Levels | Levels.1 |
|---|---|
| Previous Daily High | 2025.08 |
| Previous Daily Low | 1977.03 |
| Previous Weekly High | 1987.70 |
| Previous Weekly Low | 1944.08 |
| Previous Monthly High | 2009.88 |
| Previous Monthly Low | 1809.46 |
| Daily Fibonacci 38.2% | 2006.72 |
| Daily Fibonacci 61.8% | 1995.39 |
| Daily Pivot Point S1 | 1989.93 |
| Daily Pivot Point S2 | 1959.45 |
| Daily Pivot Point S3 | 1941.88 |
| Daily Pivot Point R1 | 2037.98 |
| Daily Pivot Point R2 | 2055.55 |
| Daily Pivot Point R3 | 2086.03 |
[/s2If]
Join Our Telegram Group


