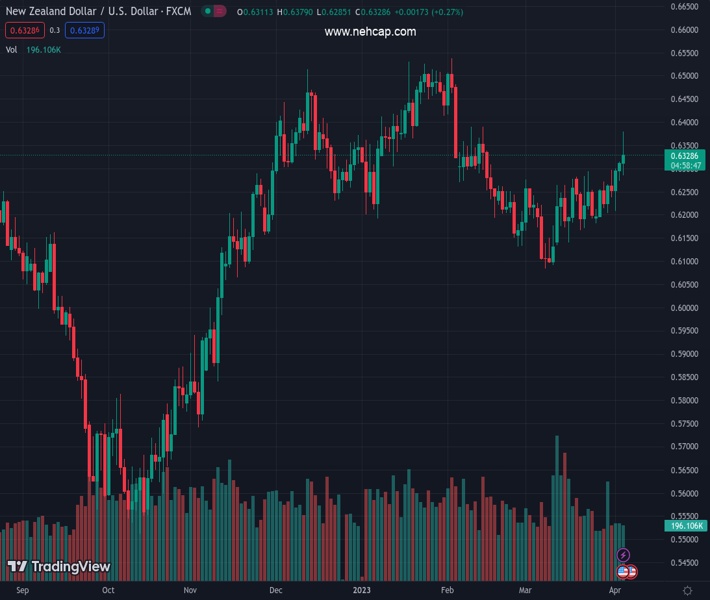
#NZDUSD @ 0.63285 The Reserve Bank of New Zealand’s decision to raise rates by 50 bps lifted the pair to new 2-month highs. (Pivot Orderbook analysis)
…
This is a premium post.
[s2If !current_user_can(access_s2member_level4)]Please register for PREMIUM VERSION HERE to read full post below containing analysis. In case of any error or you think you are not able to read the full post below, please email us at support#nehcap.com [lwa][/s2If] [s2If current_user_can(access_s2member_level4)]
- The Reserve Bank of New Zealand’s decision to raise rates by 50 bps lifted the NZD/USD pair to new 2-month highs.
- The US ADP Employment Change report for March was below estimates, as the labor market feels the Fed’s cumulative tightening.
- NZD/USD Price Analysis: Downside risks remain below 0.6400.
The pair currently trades last at 0.63285.
The previous day high was 0.6315 while the previous day low was 0.6259. The daily 38.2% Fib levels comes at 0.6294, expected to provide support. Similarly, the daily 61.8% fib level is at 0.6281, expected to provide support.
The New Zealand Dollar (NZD) reversed its course against the US Dollar (USD), after hitting a fresh two-month high at 0.6379, following an astonishing 50 bps hike by the Reserve Bank of New Zealand (RBNZ). However, sentiment shifting sour spurred flows toward safe-haven assets. Therefore, the NZD/USD is trading at 0.6331, clinging to minimal gains of 0.30%.
Economic data from the United States (US) continued to show deterioration. The ISM Non-Manufacturing PMI, also known as Services, fell to 51.2, below estimates of 54.4, and trailed February’s 55.1 reading. The index fell due to weaker new orders growth and softer business activity. Earlier data revealed that private hiring in February rose 145K below estimates of 200K and trailed January, which was upwards revised to 261K.
Given the latest round of labor market metrics pointing to deterioration, a jump in Initial Jobless Claims for the latest week could open the door for a weaker US Nonfarm Payrolls figure. Analyst estimates payrolls for March at 240K, below February’s 311K.
The greenback is recovering some ground after falling to fresh two-month lows at 101.42, as shown by the US Dollar Index. At the time of typing, the DXY sits at 101.780, up 0.41%.
On the New Zealand (NZ) front, the RBNZ surprised the markets and hiked the Overnight Cash Rate (OCR) by 50 bps to 5.25%. The RBNZ sees upside risks to inflation, according to February’s Monetary Policy Statement (MPS).
The NZD/USD remains neutral to upward biased after the RBNZ’s decision. As the NZD/USD rallied towards 0.6379 and challenged 0.6389, the February 14 high, buyers did not have the strength to crack the latter and lift the pair towards 0.6400. Therefore, NZD/USD sellers stepped in, and dragged the exchange rate toward the 0.6320 area.
Upside risks lie at 0.6390, which would pave the way to 0.6400 before testing the August 12 high at 0.6468. On the other hand, a breach of 0.6300 and the NZD/USD would dive to the 200-day EMA at 0.6268.
Technical Levels: Supports and Resistances
NZDUSD currently trading at 0.6322 at the time of writing. Pair opened at 0.6313 and is trading with a change of 0.14 % .
| Overview | Overview.1 | |
|---|---|---|
| 0 | Today last price | 0.6322 |
| 1 | Today Daily Change | 0.0009 |
| 2 | Today Daily Change % | 0.1400 |
| 3 | Today daily open | 0.6313 |
The pair remains strongly bullish on the daily timeframe. It trades above its 20 SMA @ 0.6219, 50 SMA 0.6271, 100 SMA @ 0.6298 and 200 SMA @ 0.6159.
| Trends | Trends.1 | |
|---|---|---|
| 0 | Daily SMA20 | 0.6219 |
| 1 | Daily SMA50 | 0.6271 |
| 2 | Daily SMA100 | 0.6298 |
| 3 | Daily SMA200 | 0.6159 |
The previous day high was 0.6315 while the previous day low was 0.6259. The daily 38.2% Fib levels comes at 0.6294, expected to provide support. Similarly, the daily 61.8% fib level is at 0.6281, expected to provide support.
Note the levels of interest below:
- Pivot support is noted at 0.6276, 0.624, 0.6221
- Pivot resistance is noted at 0.6332, 0.6352, 0.6388
| Levels | Levels.1 |
|---|---|
| Previous Daily High | 0.6315 |
| Previous Daily Low | 0.6259 |
| Previous Weekly High | 0.6298 |
| Previous Weekly Low | 0.6180 |
| Previous Monthly High | 0.6298 |
| Previous Monthly Low | 0.6084 |
| Daily Fibonacci 38.2% | 0.6294 |
| Daily Fibonacci 61.8% | 0.6281 |
| Daily Pivot Point S1 | 0.6276 |
| Daily Pivot Point S2 | 0.6240 |
| Daily Pivot Point S3 | 0.6221 |
| Daily Pivot Point R1 | 0.6332 |
| Daily Pivot Point R2 | 0.6352 |
| Daily Pivot Point R3 | 0.6388 |
[/s2If]
Join Our Telegram Group


