#XAGUSD @ 24.9395 Silver pulls back from a nearly one-year peak touched earlier this Wednesday. (Pivot Orderbook analysis)
…
This is a premium post.
[s2If !current_user_can(access_s2member_level4)]Please register for PREMIUM VERSION HERE to read full post below containing analysis. In case of any error or you think you are not able to read the full post below, please email us at support#nehcap.com [lwa][/s2If] [s2If current_user_can(access_s2member_level4)]
- Silver pulls back from a nearly one-year peak touched earlier this Wednesday.
- The technical setup still favours bulls and supports prospects for further gains.
- Any further slide is likely to support near the $24.40-30 resistance breakpoint.
The pair currently trades last at 24.9395.
The previous day high was 25.02 while the previous day low was 23.83. The daily 38.2% Fib levels comes at 24.56, expected to provide support. Similarly, the daily 61.8% fib level is at 24.28, expected to provide support.
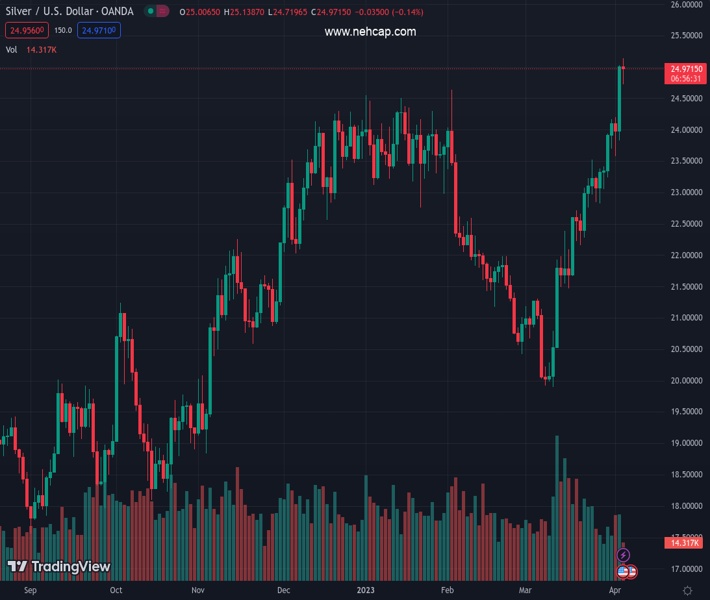
Silver retreats from the $25.10-$25.15 area, or a nearly one-year high touched this Wednesday and erodes a part of the previous day’s strong gains. The white metal remains depressed through the early North American session and is currently placed near the lower end of its daily range, around the $24.85-$24.80 region.
From a technical perspective, the overnight sustained move and acceptance above the $24.30-$24.40 strong horizontal barrier was seen as a fresh trigger for the XAG/USD bulls. A subsequent strength beyond the previous YTD peak, around the $24.65 zone, might have already set the stage for an extension of the recent strong upward trajectory witnessed over the past month or so.
The positive outlook is reinforced by the fact that the XAG/USD is holding comfortably above technically significant Simple Moving Averages (SMAs) – 50, 100 and 200-day SMAs. That said, Relative Strength Index (RSI) on the daily chart is flashing overbought conditions and makes it prudent to wait for some near-term consolidation or a modest pullback before placing fresh bullish bets.
In the meantime, any meaningful pullback is likely to attract fresh buyers and remain limited near the $24.40-$24.30 resistance breakpoint, now turned support. This should now act as a pivotal point, which if broken decisively might prompt some technical selling and make the XAG/USD vulnerable to weaken below the $24.00 mark, towards testing the weekly low, around the $23.60-$23.55 area.
Technical Levels: Supports and Resistances
XAGUSD currently trading at 24.82 at the time of writing. Pair opened at 25.0 and is trading with a change of -0.72 % .
| Overview | Overview.1 | |
|---|---|---|
| 0 | Today last price | 24.82 |
| 1 | Today Daily Change | -0.18 |
| 2 | Today Daily Change % | -0.72 |
| 3 | Today daily open | 25.00 |
The pair remains strongly bullish on the daily timeframe. It trades above its 20 SMA @ 22.56, 50 SMA 22.25, 100 SMA @ 22.65 and 200 SMA @ 21.07.
| Trends | Trends.1 | |
|---|---|---|
| 0 | Daily SMA20 | 22.56 |
| 1 | Daily SMA50 | 22.25 |
| 2 | Daily SMA100 | 22.65 |
| 3 | Daily SMA200 | 21.07 |
The previous day high was 25.02 while the previous day low was 23.83. The daily 38.2% Fib levels comes at 24.56, expected to provide support. Similarly, the daily 61.8% fib level is at 24.28, expected to provide support.
Note the levels of interest below:
- Pivot support is noted at 24.21, 23.42, 23.02
- Pivot resistance is noted at 25.41, 25.81, 26.6
| Levels | Levels.1 |
|---|---|
| Previous Daily High | 25.02 |
| Previous Daily Low | 23.83 |
| Previous Weekly High | 24.16 |
| Previous Weekly Low | 22.83 |
| Previous Monthly High | 24.16 |
| Previous Monthly Low | 19.90 |
| Daily Fibonacci 38.2% | 24.56 |
| Daily Fibonacci 61.8% | 24.28 |
| Daily Pivot Point S1 | 24.21 |
| Daily Pivot Point S2 | 23.42 |
| Daily Pivot Point S3 | 23.02 |
| Daily Pivot Point R1 | 25.41 |
| Daily Pivot Point R2 | 25.81 |
| Daily Pivot Point R3 | 26.60 |
[/s2If]
Join Our Telegram Group


