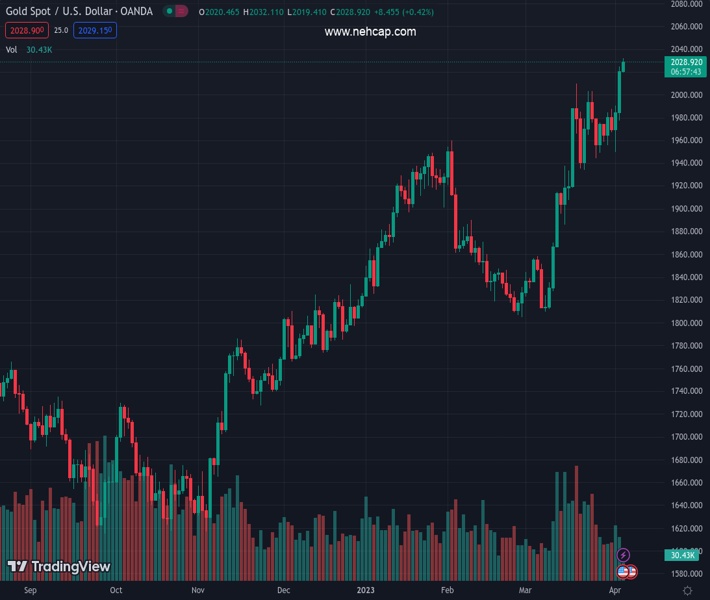
#XAUUSD @ 2,028.66 Gold price rose to $2,031/oz, new one-year high. (Pivot Orderbook analysis)
…
This is a premium post.
[s2If !current_user_can(access_s2member_level4)]Please register for PREMIUM VERSION HERE to read full post below containing analysis. In case of any error or you think you are not able to read the full post below, please email us at support#nehcap.com [lwa][/s2If] [s2If current_user_can(access_s2member_level4)]
- Gold price rose to $2,031/oz, new one-year high.
- US March ADP report came in below expectations, attention turns to ISM Service PMI.
- US yields and DXY turn lower after data.
The pair currently trades last at 2028.66.
The previous day high was 2025.08 while the previous day low was 1977.03. The daily 38.2% Fib levels comes at 2006.72, expected to provide support. Similarly, the daily 61.8% fib level is at 1995.39, expected to provide support.
Gold price printed fresh one-year highs at $2,031 after the release of US employment data. The yellow metal then pulled back modestly, and ahead of more economic reports, it is hovering around $2,020.
Automatic Data Processing (ADP) released it employment report showing that in March the private sector added 145,000 jobs, below market consensus of 200,000. February’s figures were revised higher from 242,000 to 261,000.
After the report, US yields printed fresh weekly lows and the US Dollar weakened. The numbers still show a healthy labor market, but slowing down. More data from the US is due on Wednesday with March ISM Service PMI.
Indicators remain bullish for Gold. A break above $2,030 would favor a test of the all-time high around $2,075. On the downside, the immediate support stands at $2,015 followed by $2,000.
Technical Levels: Supports and Resistances
XAUUSD currently trading at 2026.35 at the time of writing. Pair opened at 2020.4 and is trading with a change of 0.29 % .
| Overview | Overview.1 | |
|---|---|---|
| 0 | Today last price | 2026.35 |
| 1 | Today Daily Change | 5.95 |
| 2 | Today Daily Change % | 0.29 |
| 3 | Today daily open | 2020.40 |
The pair remains strongly bullish on the daily timeframe. It trades above its 20 SMA @ 1943.47, 50 SMA 1895.78, 100 SMA @ 1857.33 and 200 SMA @ 1785.72.
| Trends | Trends.1 | |
|---|---|---|
| 0 | Daily SMA20 | 1943.47 |
| 1 | Daily SMA50 | 1895.78 |
| 2 | Daily SMA100 | 1857.33 |
| 3 | Daily SMA200 | 1785.72 |
The previous day high was 2025.08 while the previous day low was 1977.03. The daily 38.2% Fib levels comes at 2006.72, expected to provide support. Similarly, the daily 61.8% fib level is at 1995.39, expected to provide support.
Note the levels of interest below:
- Pivot support is noted at 1989.93, 1959.45, 1941.88
- Pivot resistance is noted at 2037.98, 2055.55, 2086.03
| Levels | Levels.1 |
|---|---|
| Previous Daily High | 2025.08 |
| Previous Daily Low | 1977.03 |
| Previous Weekly High | 1987.70 |
| Previous Weekly Low | 1944.08 |
| Previous Monthly High | 2009.88 |
| Previous Monthly Low | 1809.46 |
| Daily Fibonacci 38.2% | 2006.72 |
| Daily Fibonacci 61.8% | 1995.39 |
| Daily Pivot Point S1 | 1989.93 |
| Daily Pivot Point S2 | 1959.45 |
| Daily Pivot Point S3 | 1941.88 |
| Daily Pivot Point R1 | 2037.98 |
| Daily Pivot Point R2 | 2055.55 |
| Daily Pivot Point R3 | 2086.03 |
[/s2If]
Join Our Telegram Group


