#USDJPY @ 131.000 US ADP March Private Employment rises by 145K in March, below 200K expected. (Pivot Orderbook analysis)
…
This is a premium post.
[s2If !current_user_can(access_s2member_level4)]Please register for PREMIUM VERSION HERE to read full post below containing analysis. In case of any error or you think you are not able to read the full post below, please email us at support#nehcap.com [lwa][/s2If] [s2If current_user_can(access_s2member_level4)]
- US ADP March Private Employment rises by 145K in March, below 200K expected.
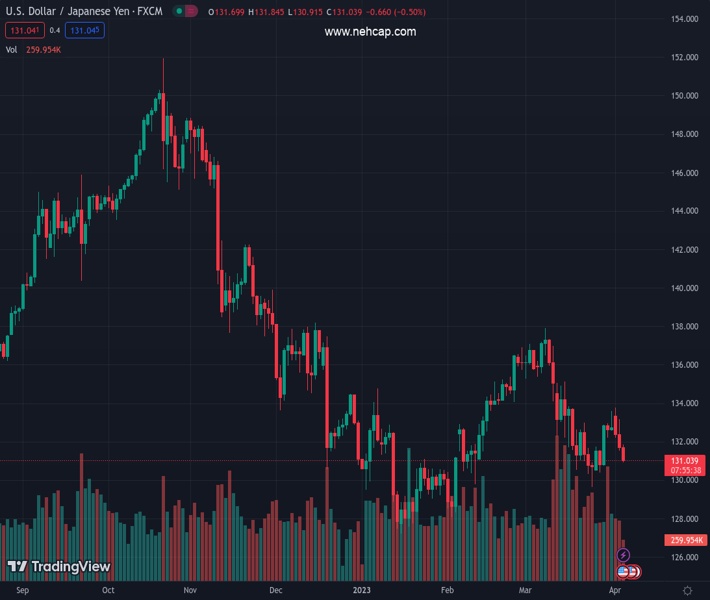
- Japanese Yen rises as US yields tumble, USD/JPY at weekly lows testing 131.00.
- Data ahead: US March ISM Service PMI, expected at 54.5.
The pair currently trades last at 131.000.
The previous day high was 133.17 while the previous day low was 131.52. The daily 38.2% Fib levels comes at 132.15, expected to provide resistance. Similarly, the daily 61.8% fib level is at 132.54, expected to provide resistance.
After moving sideways for hours, the USD/JPY broke to the downside, hitting fresh weekly lows following the release of the US ADP Employment report. The pair is testing the 131.00 area amid a weaker US dollar.
The report published by Automatic Data Processing (ADP) showed that in March the private sector added 145,000 jobs, below expectations of a 200,000 increase. February’s figures were revised higher from 242,000 to 261,000. On Friday, the Nonfarm Payrolls report is due. Later on Thursday, at 14:00 GMT, the March ISM Service PMI Index will be released.
US yields accelerated the decline after the ADP report, boosting the Japanese Yen across the board. The US 10-year yield fell to 3.30%, and is about to test March lows. The 2-year Treasury yield was at 3.89% and bottomed at 3.75%. The US Dollar Index erased daily gains and fell from 101.70 to 101.50. On Tuesday, the DXY posted the lowest daily close since early February.
The USD/JPY bottomed at 130.97, hitting the lowest level since March 29. As of writing, it is testing the 131.00 zone. A consolidation below would suggest more losses ahead, targeting the next strong support seen at 130.50/60. On the upside, the key resistance is 131.80.
Technical Levels: Supports and Resistances
USDJPY currently trading at 131.13 at the time of writing. Pair opened at 131.7 and is trading with a change of -0.43 % .
| Overview | Overview.1 | |
|---|---|---|
| 0 | Today last price | 131.13 |
| 1 | Today Daily Change | -0.57 |
| 2 | Today Daily Change % | -0.43 |
| 3 | Today daily open | 131.70 |
The pair remains strongly bearish on the daily time frame. It trades below the 20 SMA @ 132.82, 50 SMA 133.01, 100 SMA @ 133.72 and 200 SMA @ 137.28.
| Trends | Trends.1 | |
|---|---|---|
| 0 | Daily SMA20 | 132.82 |
| 1 | Daily SMA50 | 133.01 |
| 2 | Daily SMA100 | 133.72 |
| 3 | Daily SMA200 | 137.28 |
The previous day high was 133.17 while the previous day low was 131.52. The daily 38.2% Fib levels comes at 132.15, expected to provide resistance. Similarly, the daily 61.8% fib level is at 132.54, expected to provide resistance.
Note the levels of interest below:
- Pivot support is noted at 131.09, 130.48, 129.45
- Pivot resistance is noted at 132.74, 133.78, 134.39
| Levels | Levels.1 |
|---|---|
| Previous Daily High | 133.17 |
| Previous Daily Low | 131.52 |
| Previous Weekly High | 133.60 |
| Previous Weekly Low | 130.41 |
| Previous Monthly High | 137.91 |
| Previous Monthly Low | 129.64 |
| Daily Fibonacci 38.2% | 132.15 |
| Daily Fibonacci 61.8% | 132.54 |
| Daily Pivot Point S1 | 131.09 |
| Daily Pivot Point S2 | 130.48 |
| Daily Pivot Point S3 | 129.45 |
| Daily Pivot Point R1 | 132.74 |
| Daily Pivot Point R2 | 133.78 |
| Daily Pivot Point R3 | 134.39 |
[/s2If]
Join Our Telegram Group


