#GBPUSD @ 1.24890 oscillates in a narrow trading band through the early European session on Wednesday. (Pivot Orderbook analysis)
…
This is a premium post.
[s2If !current_user_can(access_s2member_level4)]Please register for PREMIUM VERSION HERE to read full post below containing analysis. In case of any error or you think you are not able to read the full post below, please email us at support#nehcap.com [lwa][/s2If] [s2If current_user_can(access_s2member_level4)]
- GBP/USD oscillates in a narrow trading band through the early European session on Wednesday.
- A combination of factors lends some support to the USD and acts as a headwind for the major.
- Bets for an imminent Fed rate-hike pause continue to cap the buck and help limit the downside.
The pair currently trades last at 1.24890.
The previous day high was 1.2525 while the previous day low was 1.2395. The daily 38.2% Fib levels comes at 1.2476, expected to provide support. Similarly, the daily 61.8% fib level is at 1.2445, expected to provide support.
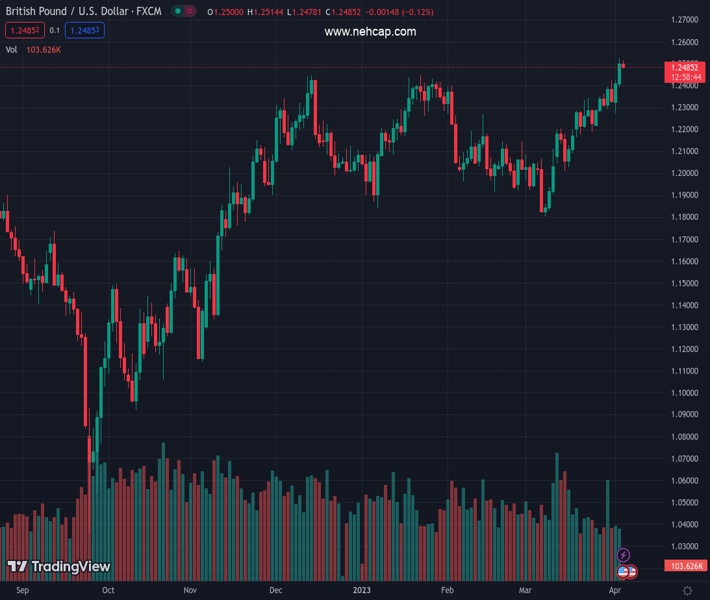
The GBP/USD pair is seen oscillating in a narrow trading band through the early part of the European session on Wednesday and consolidates its recent gains to its highest level since June 2022 touched the previous day. The pair is currently placed around the 1.2500 psychological mark and seems poised to prolong the upward trajectory witnessed over the past month or so.
A modest intraday uptick in the US Treasury bond yields, along with a mildly softer risk tone, assist the safe-haven US Dollar to stall its recent downfall to over a two-month low, which, in turn, acts as a headwind for the GBP/USD pair. The USD, however, struggles to gain any meaningful traction amid firming expectations that the Federal Reserve (Fed) is nearly done with its tightening cycle. In fact, the current market pricing indicates an even chance of a 25 bps lift-off at the May FOMC meeting and the possibility of rate cuts by end-December.
The bets were reaffirmed by the weaker US macro data on Tuesday, which showed that job openings in February dropped to the lowest in nearly two years and Factory Orders declined for the second straight month. The Labor Department’s monthly Job Openings and Labor Turnover Survey, or JOLTS report, was seen as a sign that the Fed’s efforts to slow the labor market may be having some impact. This, in turn, should keep a lid on any meaningful upside for the US bond yields and hold back the USD bulls from placing aggressive bets.
The aforementioned factors, to a larger extent, helps offset mixed signals from the Bank of England (BoE) policymakers over the future rate-hike path. In fact, the BoE MPC member Silvana Tenreyro on Tuesday advocated for consideration of cutting rates sooner than thought as the absence of cost-push shocks would bring down inflation well below targets. In contrast, the BoE Chief Economist Huw Pill said that action is still needed in assessing inflation prospects and that the onus remains on ensuring enough policy tightening is delivered to see the job through.
The lack of any meaningful selling, meanwhile, suggests that the path of least resistance for the GBP/USD pair is to the upside. Bullish traders, however, seem reluctant to place fresh bets and prefer to move to the sidelines ahead of the closely-watched US monthly jobs data – popularly known as the NFP report – on Friday. Heading into the key data risk, Wednesday’s US economic docket, featuring the ADP report on private-sector employment and the ISM Services PMI, due might provide some impetus later during the early North American session.
Technical Levels: Supports and Resistances
GBPUSD currently trading at 1.2493 at the time of writing. Pair opened at 1.2502 and is trading with a change of -0.07 % .
| Overview | Overview.1 | |
|---|---|---|
| 0 | Today last price | 1.2493 |
| 1 | Today Daily Change | -0.0009 |
| 2 | Today Daily Change % | -0.0700 |
| 3 | Today daily open | 1.2502 |
The pair remains strongly bullish on the daily timeframe. It trades above its 20 SMA @ 1.2217, 50 SMA 1.2153, 100 SMA @ 1.2143 and 200 SMA @ 1.1897.
| Trends | Trends.1 | |
|---|---|---|
| 0 | Daily SMA20 | 1.2217 |
| 1 | Daily SMA50 | 1.2153 |
| 2 | Daily SMA100 | 1.2143 |
| 3 | Daily SMA200 | 1.1897 |
The previous day high was 1.2525 while the previous day low was 1.2395. The daily 38.2% Fib levels comes at 1.2476, expected to provide support. Similarly, the daily 61.8% fib level is at 1.2445, expected to provide support.
Note the levels of interest below:
- Pivot support is noted at 1.2423, 1.2344, 1.2293
- Pivot resistance is noted at 1.2553, 1.2604, 1.2683
| Levels | Levels.1 |
|---|---|
| Previous Daily High | 1.2525 |
| Previous Daily Low | 1.2395 |
| Previous Weekly High | 1.2424 |
| Previous Weekly Low | 1.2219 |
| Previous Monthly High | 1.2424 |
| Previous Monthly Low | 1.1803 |
| Daily Fibonacci 38.2% | 1.2476 |
| Daily Fibonacci 61.8% | 1.2445 |
| Daily Pivot Point S1 | 1.2423 |
| Daily Pivot Point S2 | 1.2344 |
| Daily Pivot Point S3 | 1.2293 |
| Daily Pivot Point R1 | 1.2553 |
| Daily Pivot Point R2 | 1.2604 |
| Daily Pivot Point R3 | 1.2683 |
[/s2If]
Join Our Telegram Group


