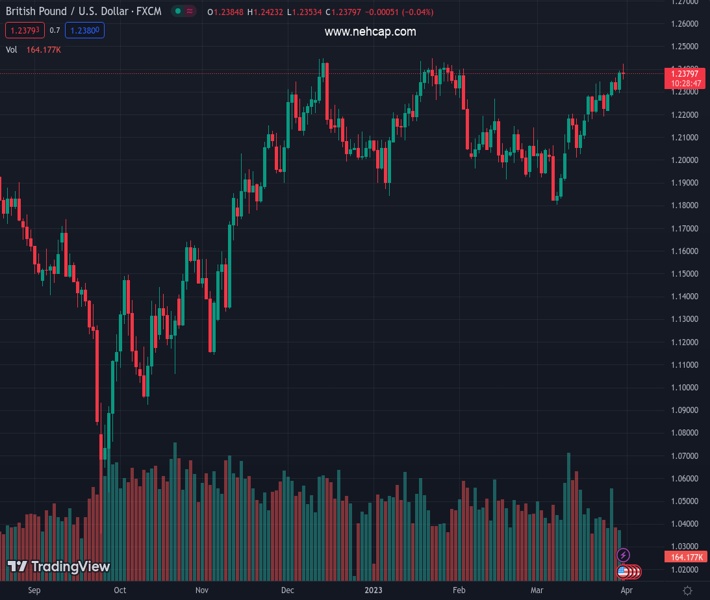
#GBPUSD @ 1.23790 pulls back from over a two-month high amid a modest pickup in the USD demand. (Pivot Orderbook analysis)
…
This is a premium post.
[s2If !current_user_can(access_s2member_level4)]Please register for PREMIUM VERSION HERE to read full post below containing analysis. In case of any error or you think you are not able to read the full post below, please email us at support#nehcap.com [lwa][/s2If] [s2If current_user_can(access_s2member_level4)]
- GBP/USD pulls back from over a two-month high amid a modest pickup in the USD demand.
- The better-than-expected UK GDP reaffirms BoE rate hike bets and helps limit the downside.
- Traders also seem reluctant and prefer to wait for the release of the US Core PCE Price Index.
The pair currently trades last at 1.23790.
The previous day high was 1.2393 while the previous day low was 1.2294. The daily 38.2% Fib levels comes at 1.2355, expected to provide support. Similarly, the daily 61.8% fib level is at 1.2332, expected to provide support.
The GBP/USD pair comes under some selling pressure after touching over a two-month high, around the 1.2420-1.2425 area on Friday and maintains its offered tone through the first half of the European session. The pair is currently placed near the lower end of its daily trading range, around the 1.2370-1.2365 zone, down nearly 0.15% for the day.
A goodish pickup in the US Treasury bond yields helps revive the US Dollar (USD) demand on the last day of the week, which turns out to be a key factor dragging the GBP/USD pair lower. Hopes that a widespread banking crisis might have been averted fueled speculations that the US central bank might move back to its inflation-fighting interest rate hikes. Adding to this, three Fed officials on Thursday backed the case for more rate increases to lower high levels of inflation. This, in turn, acts as a tailwind for the US bond yields and lends some support to the Greenback.
Hence, the market focus will remain glued to the release of the US Core PCE Price Index, the Fed’s preferred inflation gauge, due later during the early North American session. Heading into the key data risk, traders seem inclined to lighten their bullish bets around the GBP/USD pair, especially after this week’s rally of over 200 pips. That said, the slightly better-than-expected UK GDP print reaffirms expectations for additional rate hikes by the Bank of England (BoE), which, in turn, holds back bearish traders from placing aggressive bets around the major, at least for now.
Apart from this, the prevalent risk-on mood – as depicted by an extension of the recent rally in the equity markets – keeps a lid on any meaningful gains for the safe-haven buck and contributes to limiting the downside for the GBP/USD pair. This makes it prudent to wait for strong follow-through selling before confirming that the upward trajectory witnessed since the first half of the current month has run out of steam and positioning for any meaningful depreciating move. Nevertheless, spot prices remain on track to end in positive territory for the sixth successive week.
Technical Levels: Supports and Resistances
GBPUSD currently trading at 1.2374 at the time of writing. Pair opened at 1.2388 and is trading with a change of -0.11 % .
| Overview | Overview.1 | |
|---|---|---|
| 0 | Today last price | 1.2374 |
| 1 | Today Daily Change | -0.0014 |
| 2 | Today Daily Change % | -0.1100 |
| 3 | Today daily open | 1.2388 |
The pair remains strongly bullish on the daily timeframe. It trades above its 20 SMA @ 1.2149, 50 SMA 1.215, 100 SMA @ 1.2125 and 200 SMA @ 1.1895.
| Trends | Trends.1 | |
|---|---|---|
| 0 | Daily SMA20 | 1.2149 |
| 1 | Daily SMA50 | 1.2150 |
| 2 | Daily SMA100 | 1.2125 |
| 3 | Daily SMA200 | 1.1895 |
The previous day high was 1.2393 while the previous day low was 1.2294. The daily 38.2% Fib levels comes at 1.2355, expected to provide support. Similarly, the daily 61.8% fib level is at 1.2332, expected to provide support.
Note the levels of interest below:
- Pivot support is noted at 1.2324, 1.2259, 1.2225
- Pivot resistance is noted at 1.2423, 1.2458, 1.2522
| Levels | Levels.1 |
|---|---|
| Previous Daily High | 1.2393 |
| Previous Daily Low | 1.2294 |
| Previous Weekly High | 1.2344 |
| Previous Weekly Low | 1.2167 |
| Previous Monthly High | 1.2402 |
| Previous Monthly Low | 1.1915 |
| Daily Fibonacci 38.2% | 1.2355 |
| Daily Fibonacci 61.8% | 1.2332 |
| Daily Pivot Point S1 | 1.2324 |
| Daily Pivot Point S2 | 1.2259 |
| Daily Pivot Point S3 | 1.2225 |
| Daily Pivot Point R1 | 1.2423 |
| Daily Pivot Point R2 | 1.2458 |
| Daily Pivot Point R3 | 1.2522 |
[/s2If]
Join Our Telegram Group


