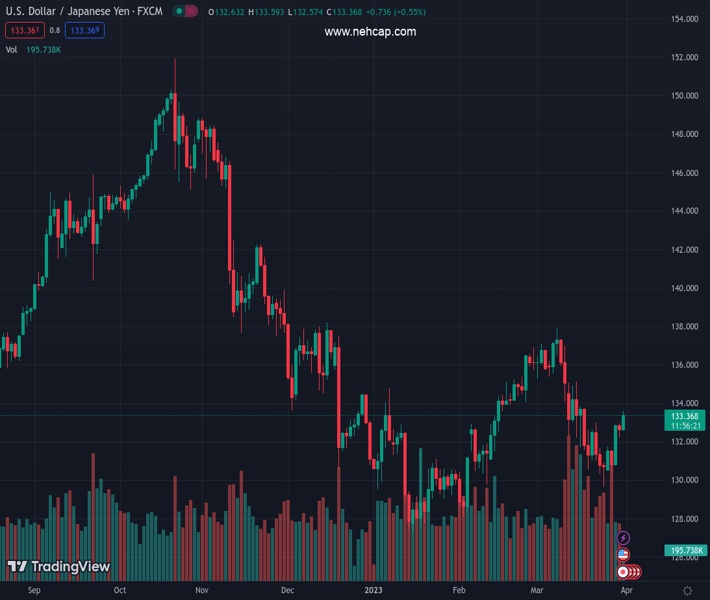
#USDJPY @ 133.406 catches fresh bids on Friday and climbs to a two-week high. (Pivot Orderbook analysis)
…
This is a premium post.
[s2If !current_user_can(access_s2member_level4)]Please register for PREMIUM VERSION HERE to read full post below containing analysis. In case of any error or you think you are not able to read the full post below, please email us at support#nehcap.com [lwa][/s2If] [s2If current_user_can(access_s2member_level4)]
- USD/JPY catches fresh bids on Friday and climbs to a two-week high.
- The recent risk-on rally undermines the JPY and lends some support.
- Rising US bond yields revive the USD demand and act as a tailwind.
- Traders now look to the US Core PCE Price Index for a fresh impetus.
The pair currently trades last at 133.406.
The previous day high was 132.97 while the previous day low was 132.21. The daily 38.2% Fib levels comes at 132.5, expected to provide support. Similarly, the daily 61.8% fib level is at 132.68, expected to provide support.
The USD/JPY pair regains positive traction on the last day of the week and maintains its bid tone near a two-week high, just below mid-133.00s through the early part of the European session.
The recent risk-on rally across the global equity markets undermines the safe-haven Japanese Yen (JPY), which, along with the emergence of some US Dollar (USD) buying, acts as a tailwind for the USD/JPY pair. Investors now seem convinced that a widespread banking crisis might have been averted. Apart from this, hopes for a strong economic recovery in China further boost investors’ confidence. In fact, the official Chinese PMI data showed that business activity in the services sector grew at its fastest pace in 12 years in March. Meanwhile, the growth in the manufacturing sector moderated a bit during the reported month, albeit at a smaller-than-expected pace.
The USD, on the other hand, draws some support from a modest uptick in the US Treasury bond yields, bolstered by fresh speculations that the Federal Reserve (Fed) might move back to its inflation-fighting interest rate hikes. Furthermore, three Fed officials on Thursday backed the case for more rate increases to lower high levels of inflation. The US central bank, however, had signalled recently that it might soon pause the rate-hiking cycle in the wake of the turmoil in the banking sector. This, in turn, could act as a headwind for the USD/JPY pair.
Traders also seem reluctant to place aggressive bets and might prefer to move to the sidelines ahead of the release of the US Core PCE Price Index – the Fed’s preferred inflation gauge – later during the early North American session. The data will play a key role in influencing market expectations about the future rate hike path, which, in turn, will drive the USD demand and provide a fresh directional impetus to the USD/JPY pair. Nevertheless, spot prices remain on track to register strong weekly gains for the first time in the previous five.
Technical Levels: Supports and Resistances
USDJPY currently trading at 133.3 at the time of writing. Pair opened at 132.67 and is trading with a change of 0.47 % .
| Overview | Overview.1 | |
|---|---|---|
| 0 | Today last price | 133.30 |
| 1 | Today Daily Change | 0.63 |
| 2 | Today Daily Change % | 0.47 |
| 3 | Today daily open | 132.67 |
The pair is trading below its 20 Daily moving average @ 133.42, above its 50 Daily moving average @ 132.88 , below its 100 Daily moving average @ 133.93 and below its 200 Daily moving average @ 137.33
| Trends | Trends.1 | |
|---|---|---|
| 0 | Daily SMA20 | 133.42 |
| 1 | Daily SMA50 | 132.88 |
| 2 | Daily SMA100 | 133.93 |
| 3 | Daily SMA200 | 137.33 |
The previous day high was 132.97 while the previous day low was 132.21. The daily 38.2% Fib levels comes at 132.5, expected to provide support. Similarly, the daily 61.8% fib level is at 132.68, expected to provide support.
Note the levels of interest below:
- Pivot support is noted at 132.26, 131.85, 131.5
- Pivot resistance is noted at 133.02, 133.38, 133.79
| Levels | Levels.1 |
|---|---|
| Previous Daily High | 132.97 |
| Previous Daily Low | 132.21 |
| Previous Weekly High | 133.00 |
| Previous Weekly Low | 129.64 |
| Previous Monthly High | 136.92 |
| Previous Monthly Low | 128.08 |
| Daily Fibonacci 38.2% | 132.50 |
| Daily Fibonacci 61.8% | 132.68 |
| Daily Pivot Point S1 | 132.26 |
| Daily Pivot Point S2 | 131.85 |
| Daily Pivot Point S3 | 131.50 |
| Daily Pivot Point R1 | 133.02 |
| Daily Pivot Point R2 | 133.38 |
| Daily Pivot Point R3 | 133.79 |
[/s2If]
Join Our Telegram Group


