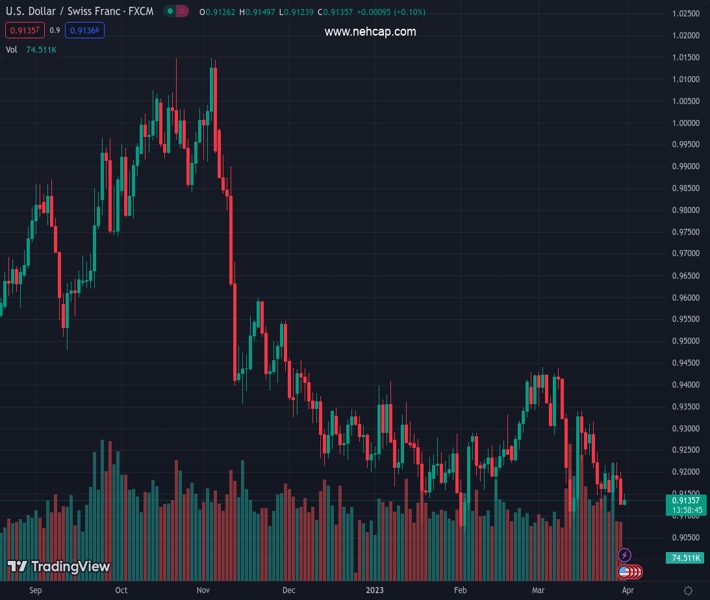
#USDCHF @ 0.91362 bounces off one-week low to print the first daily gain in three, retreats from intraday high of late., @nehcap view: Further downside expected (Pivot Orderbook analysis)
…
This is a premium post.
[s2If !current_user_can(access_s2member_level4)]Please register for PREMIUM VERSION HERE to read full post below containing analysis. In case of any error or you think you are not able to read the full post below, please email us at support#nehcap.com [lwa][/s2If] [s2If current_user_can(access_s2member_level4)]
- USD/CHF bounces off one-week low to print the first daily gain in three, retreats from intraday high of late.
- Clear downside break of 13-day-old previous support, bearish MACD signals keep sellers hopeful.
- 50-EMA, descending resistance line from early March challenge Swiss Franc pair buyers.
The pair currently trades last at 0.91362.
The previous day high was 0.9201 while the previous day low was 0.9126. The daily 38.2% Fib levels comes at 0.9155, expected to provide resistance. Similarly, the daily 61.8% fib level is at 0.9172, expected to provide resistance.
USD/CHF pares the first daily gain in three around 0.9135 as the market’s anxiety ahead of the key US inflation data escalates during the initial hour of Friday’s European session. In doing so, the Swiss Franc (CHF) pair reverses from the previous support line from mid-March.
Not only the failure to cross the support-turned-resistance but the bearish MACD signals also weigh on the USD/CHF price.
As a result, the Swiss currency pair sellers are well-set to challenge an upward-sloping support line from early February, around 0.9110 by the press time.
It should be noted that a clear break of the said key support line will need validation from the 0.9100 round figure and the previous monthly low of around 0.9060 to convince the USD/CHF bears to prod the 0.9000 psychological magnet.
Meanwhile, an upside break of the aforementioned previous support line, close to 0.9150, isn’t an open invitation to the USD/CHF bulls.
The reason could be linked to the presence of a convergence of the 50-bar Exponential Moving Average (EMA) and a downward-sloping resistance line from March 09, close to 0.9190.
Even if the USD/CHF bulls manage to cross the 0.9190 resistance confluence, the 0.9200 round figure and 61.8% Fibonacci retracement level of its February-March upside, near 0.9205, may act as an extra check for the buyers.
Trend: Further downside expected
Technical Levels: Supports and Resistances
USDCHF currently trading at 0.9143 at the time of writing. Pair opened at 0.9129 and is trading with a change of 0.15% % .
| Overview | Overview.1 | |
|---|---|---|
| 0 | Today last price | 0.9143 |
| 1 | Today Daily Change | 0.0014 |
| 2 | Today Daily Change % | 0.15% |
| 3 | Today daily open | 0.9129 |
The pair remains strongly bearish on the daily time frame. It trades below the 20 SMA @ 0.9247, 50 SMA 0.9251, 100 SMA @ 0.93 and 200 SMA @ 0.9521.
| Trends | Trends.1 | |
|---|---|---|
| 0 | Daily SMA20 | 0.9247 |
| 1 | Daily SMA50 | 0.9251 |
| 2 | Daily SMA100 | 0.9300 |
| 3 | Daily SMA200 | 0.9521 |
The previous day high was 0.9201 while the previous day low was 0.9126. The daily 38.2% Fib levels comes at 0.9155, expected to provide resistance. Similarly, the daily 61.8% fib level is at 0.9172, expected to provide resistance.
Note the levels of interest below:
- Pivot support is noted at 0.9103, 0.9078, 0.9029
- Pivot resistance is noted at 0.9178, 0.9226, 0.9252
| Levels | Levels.1 |
|---|---|
| Previous Daily High | 0.9201 |
| Previous Daily Low | 0.9126 |
| Previous Weekly High | 0.9317 |
| Previous Weekly Low | 0.9120 |
| Previous Monthly High | 0.9429 |
| Previous Monthly Low | 0.9059 |
| Daily Fibonacci 38.2% | 0.9155 |
| Daily Fibonacci 61.8% | 0.9172 |
| Daily Pivot Point S1 | 0.9103 |
| Daily Pivot Point S2 | 0.9078 |
| Daily Pivot Point S3 | 0.9029 |
| Daily Pivot Point R1 | 0.9178 |
| Daily Pivot Point R2 | 0.9226 |
| Daily Pivot Point R3 | 0.9252 |
[/s2If]
Join Our Telegram Group


