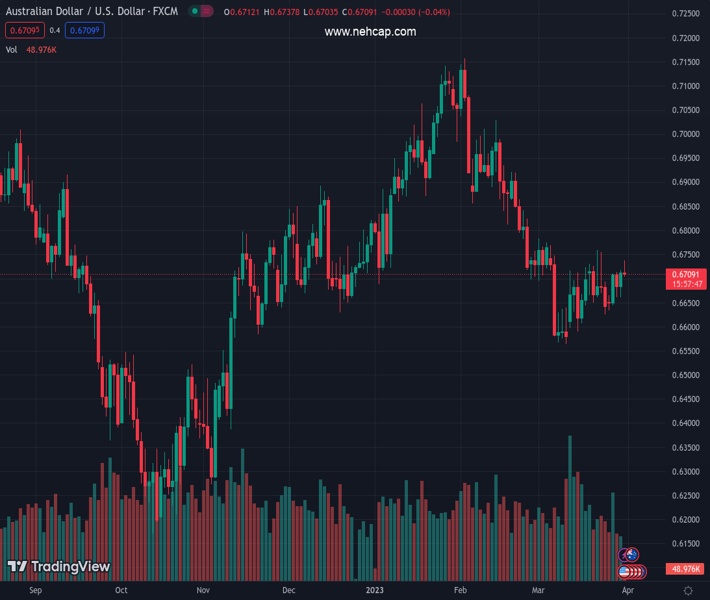
#AUDUSD @ 0.67107 retreats after refreshing one-week high, mildly bid of late., @nehcap view: Further upside expected (Pivot Orderbook analysis)
…
This is a premium post.
[s2If !current_user_can(access_s2member_level4)]Please register for PREMIUM VERSION HERE to read full post below containing analysis. In case of any error or you think you are not able to read the full post below, please email us at support#nehcap.com [lwa][/s2If] [s2If current_user_can(access_s2member_level4)]
- AUD/USD retreats after refreshing one-week high, mildly bid of late.
- Bullish MACD signals, upbeat RSI (14) keeps Aussie pair buyers hopeful.
- Convergence of 200-DMA, monthly triangle’s upper line restrict immediate advances.
- Bears remain off the table unless breaking 0.6520.
The pair currently trades last at 0.67107.
The previous day high was 0.6718 while the previous day low was 0.6661. The daily 38.2% Fib levels comes at 0.6697, expected to provide support. Similarly, the daily 61.8% fib level is at 0.6683, expected to provide support.
AUD/USD pares intraday gains around 0.6720, following the run-up to refresh weekly top to near 0.6740, as markets brace for the key US inflation clues during early Friday. Even so, the Aussie pair remains inside a monthly symmetrical triangle.
It’s worth noting that upbeat China PMI and broad US Dollar weakness, amid receding hawkish Fed bets, previously propelled the AUD/USD pair to renew a one-week high.
Even if the Aussie pair fades upside momentum ahead of the key data, bullish MACD signals join the above 50 levels of RSI (14), not overbought, to keep the buyers hopeful.
However, the 200-DMA and the stated triangle’s top line, close to 0.6750, appear a tough nut to crack for the AUD/USD bulls to crack.
Following that, a run-up towards the early February lows near 0.6855 and then to the last December’s high of around 0.6895 can’t be ruled out.
On the contrary, pullback moves need to defy the triangle formation, by slipping beneath the support line of 0.6660, to convince AUD/USD bears.
In that case, the 61.8% Fibonacci retracement of the pair’s November-February upside precedes the previous resistance line from February, respectively near 0.6610 and 0.6520, to challenge the AUD/USD sellers afterward.
Trend: Further upside expected
Technical Levels: Supports and Resistances
AUDUSD currently trading at 0.6719 at the time of writing. Pair opened at 0.6712 and is trading with a change of 0.10% % .
| Overview | Overview.1 | |
|---|---|---|
| 0 | Today last price | 0.6719 |
| 1 | Today Daily Change | 0.0007 |
| 2 | Today Daily Change % | 0.10% |
| 3 | Today daily open | 0.6712 |
The pair is trading above its 20 Daily moving average @ 0.6666, below its 50 Daily moving average @ 0.6825 , below its 100 Daily moving average @ 0.68 and below its 200 Daily moving average @ 0.6753
| Trends | Trends.1 | |
|---|---|---|
| 0 | Daily SMA20 | 0.6666 |
| 1 | Daily SMA50 | 0.6825 |
| 2 | Daily SMA100 | 0.6800 |
| 3 | Daily SMA200 | 0.6753 |
The previous day high was 0.6718 while the previous day low was 0.6661. The daily 38.2% Fib levels comes at 0.6697, expected to provide support. Similarly, the daily 61.8% fib level is at 0.6683, expected to provide support.
Note the levels of interest below:
- Pivot support is noted at 0.6676, 0.664, 0.662
- Pivot resistance is noted at 0.6733, 0.6754, 0.679
| Levels | Levels.1 |
|---|---|
| Previous Daily High | 0.6718 |
| Previous Daily Low | 0.6661 |
| Previous Weekly High | 0.6759 |
| Previous Weekly Low | 0.6625 |
| Previous Monthly High | 0.7158 |
| Previous Monthly Low | 0.6698 |
| Daily Fibonacci 38.2% | 0.6697 |
| Daily Fibonacci 61.8% | 0.6683 |
| Daily Pivot Point S1 | 0.6676 |
| Daily Pivot Point S2 | 0.6640 |
| Daily Pivot Point S3 | 0.6620 |
| Daily Pivot Point R1 | 0.6733 |
| Daily Pivot Point R2 | 0.6754 |
| Daily Pivot Point R3 | 0.6790 |
[/s2If]
Join Our Telegram Group


