#USDINR @ 82.1130 seesaws around three-week low amid cautious markets. (Pivot Orderbook analysis)
…
This is a premium post.
[s2If !current_user_can(access_s2member_level4)]Please register for PREMIUM VERSION HERE to read full post below containing analysis. In case of any error or you think you are not able to read the full post below, please email us at support#nehcap.com [lwa][/s2If] [s2If current_user_can(access_s2member_level4)]
- USD/INR seesaws around three-week low amid cautious markets.
- Yields grind higher but receding hawkish Fed bets favor Indian Rupee buyers.
- Second-tier statistics from India can entertain traders ahead of US Core PCE Price Index.
- Easing US inflation could weigh on US Dollar, especially amid banking-led optimism.
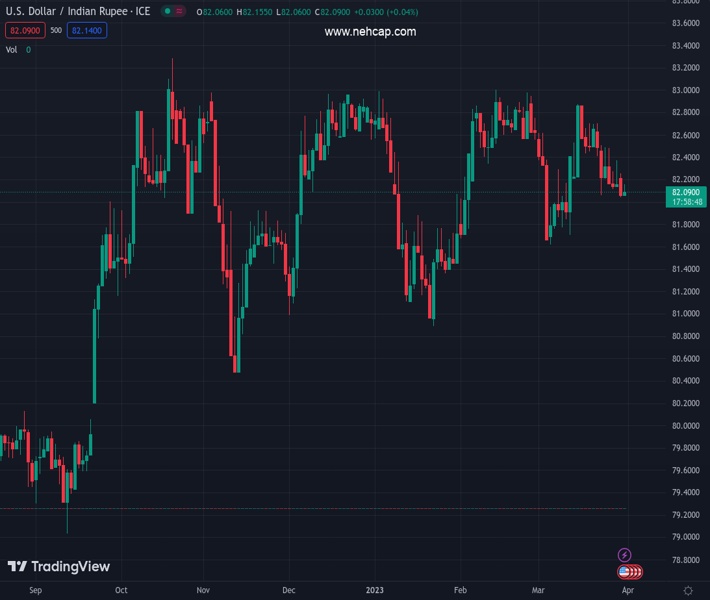
The pair currently trades last at 82.1130.
The previous day high was 82.2795 while the previous day low was 82.03. The daily 38.2% Fib levels comes at 82.1253, expected to provide resistance. Similarly, the daily 61.8% fib level is at 82.1842, expected to provide resistance.
USD/INR stays defensive above 82.00, keeping the latest bounce off three-week low amid Friday’s sluggish Asian session. In doing so, the Indian Rupee (INR) pair portrays the market’s anxiety ahead of the key US inflation clues. However, recently easing hawkish bias about the Federal Reserve’s (Fed) next moves seem to favor the bears.
As per the latest reading of the CME’s FedWatch Tool, traders place a nearly 50% chance of a 0.25% rate hike in the May month Federal Open Market Committee (FOMC) Monetary policy meeting, versus 60% the previous day.
While tracing the clues, mixed US data could be held responsible as final readings of the US fourth quarter (Q4) Gross Domestic Product (GDP), also known as the Real GDP, marked an easy Annualized growth number of 2.6% versus 2.7% previous forecasts. It’s worth noting that the Q4 Personal Consumption Expenditure (PCE) Prices matched 3.7% QoQ forecasts and prior while the Core PCE figure grew to 4.4% QoQ versus 4.3% expected and prior. Moving on, the Weekly Initial Jobless Claims rose to 198K for the week ended on March 25 versus 191K prior and 196K market forecasts.
Even so, the recent hawkish rhetoric of the Fed officials and strong US inflation expectations challenge the USD/INR bears. That said, Fed Jerome Powell joined Boston Fed President Susan Collins, Minneapolis Fed Leader Neel Kashkari and Richmond Fed President Thomas Barkin to suggest the US central bank’s further rate hike to tame the inflation woes. However, mixed US data raise doubts about the Fed policymakers’ hawkish rhetoric and rather concentrated on their rejection of banking crisis woes to weigh on the US Dollar, as well the Fed bets.
While portraying the mood, the S&P 500 Futures refresh a three-week high by tracing Wall Street’s upbeat sentiment. Though, the US 10-year Treasury bond yields rose two basis points (bps) to 3.57% whereas the two-year counterpart grinds higher to 4.13% during a five-day uptrend. Amid these plays, the US Dollar Index (DXY) licks its wounds near 102.20 after refreshing the weekly low.
Looking forward, India’s Q4 Balance Payment and Current Account details may allow USD/INR intermediate directions as those figures have previously weighed on the INR. However, major attention will be given to the Core Personal Consumption Expenditure (PCE) Price Index for February.
Also read: US February PCE Inflation Preview: Bad news for the Dollar, good news for the Fed?
A 10-week-old ascending support line, near the 82.00 threshold at the latest, restricts the immediate downside of the USD/INR price. The recovery moves, however, need validation from the 50-DMA hurdle surrounding 82.35. It’s worth noting that the bearish MACD signals join the pair’s sustained trading below the key moving averages to keep the sellers hopeful.
Technical Levels: Supports and Resistances
USDINR currently trading at 82.1268 at the time of writing. Pair opened at 82.1203 and is trading with a change of 0.01% % .
| Overview | Overview.1 | |
|---|---|---|
| 0 | Today last price | 82.1268 |
| 1 | Today Daily Change | 0.0065 |
| 2 | Today Daily Change % | 0.01% |
| 3 | Today daily open | 82.1203 |
The pair is trading below its 20 Daily moving average @ 82.2657, below its 50 Daily moving average @ 82.2898 , below its 100 Daily moving average @ 82.159 and above its 200 Daily moving average @ 81.2987
| Trends | Trends.1 | |
|---|---|---|
| 0 | Daily SMA20 | 82.2657 |
| 1 | Daily SMA50 | 82.2898 |
| 2 | Daily SMA100 | 82.1590 |
| 3 | Daily SMA200 | 81.2987 |
The previous day high was 82.2795 while the previous day low was 82.03. The daily 38.2% Fib levels comes at 82.1253, expected to provide resistance. Similarly, the daily 61.8% fib level is at 82.1842, expected to provide resistance.
Note the levels of interest below:
- Pivot support is noted at 82.0071, 81.8938, 81.7576
- Pivot resistance is noted at 82.2565, 82.3927, 82.506
| Levels | Levels.1 |
|---|---|
| Previous Daily High | 82.2795 |
| Previous Daily Low | 82.0300 |
| Previous Weekly High | 82.8926 |
| Previous Weekly Low | 82.0371 |
| Previous Monthly High | 83.0820 |
| Previous Monthly Low | 81.5032 |
| Daily Fibonacci 38.2% | 82.1253 |
| Daily Fibonacci 61.8% | 82.1842 |
| Daily Pivot Point S1 | 82.0071 |
| Daily Pivot Point S2 | 81.8938 |
| Daily Pivot Point S3 | 81.7576 |
| Daily Pivot Point R1 | 82.2565 |
| Daily Pivot Point R2 | 82.3927 |
| Daily Pivot Point R3 | 82.5060 |
[/s2If]
Join Our Telegram Group


