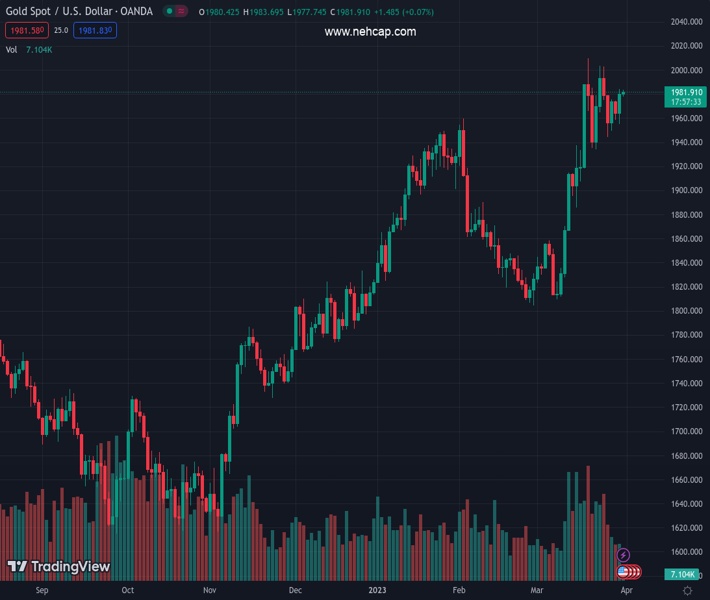
#XAUUSD @ 1,981.84 Gold price is looking to sustain its business firmly above $1,980.00 as investors see no rate hike in May. (Pivot Orderbook analysis)
…
This is a premium post.
[s2If !current_user_can(access_s2member_level4)]Please register for PREMIUM VERSION HERE to read full post below containing analysis. In case of any error or you think you are not able to read the full post below, please email us at support#nehcap.com [lwa][/s2If] [s2If current_user_can(access_s2member_level4)]
- Gold price is looking to sustain its business firmly above $1,980.00 as investors see no rate hike in May.
- The USD Index has shown some signs of recovery from 102.00, however, the downside is still favored.
- Gold price is auctioning in a Symmetrical Triangle pattern, which is indicating volatility contraction ahead of the Fed’s preferred inflation tool.
The pair currently trades last at 1981.84.
The previous day high was 1984.37 while the previous day low was 1955.39. The daily 38.2% Fib levels comes at 1973.3, expected to provide support. Similarly, the daily 61.8% fib level is at 1966.46, expected to provide support.
Gold price (XAU/USD) is aiming to sustain its auction above the critical resistance of $1,980.00 in the Asian session. The precious metal is looking to surpass Thursday’s high of $1,984.65 despite the US Dollar Index (DXY) has shown some signs of recovery from 102.00.
S&P500 futures have generated significant gains in the Asian session. US equities have carry-forwarded the buying spree firmly, portraying a cheerful market mood. Meanwhile, the demand for US government bonds has been trimmed further in hopes of no further casualties in the United States banking sector.
The recovery move from the USD Index has to pass plenty of filters as investors are anticipating an unchanged monetary policy stance in May by the Federal Reserve (Fed). In a private meeting with US lawmakers, Fed chair Jerome Powell cited that he anticipates one more rate hike in 2023. The statement from Fed Powell is not restricted to the May policy. Therefore, the chances of a steady monetary policy in May are extremely solid.
On Friday, the USD Index will remain in action ahead of the release of the core Personal Consumption Expenditure (PCE) Price Index data. Analysts at Wells Fargo have forecasted the PCE deflator (+0.4%) to outpace nominal spending (+0.3%).
Gold price is auctioning in a Symmetrical Triangle chart pattern on an hourly scale, which is indicating a sheer volatility contraction ahead of Fed’s preferred inflation tool. The upward-sloping trendline of the chart pattern is plotted from March 22 low at $1,934.34 while the downward-sloping trendline is placed from March 20 high at $2,009.88.
Broadly the Gold price is overlapping the 50-period Exponential Moving Average (EMA) at above $1,970.00, which indicates that the consolidation is still on.
The Relative Strength Index (RSI) (14) is oscillating in the bullish range of 60.00-80.00, which favors more upside ahead.
Technical Levels: Supports and Resistances
XAUUSD currently trading at 1982.02 at the time of writing. Pair opened at 1980.39 and is trading with a change of 0.08 % .
| Overview | Overview.1 | |
|---|---|---|
| 0 | Today last price | 1982.02 |
| 1 | Today Daily Change | 1.63 |
| 2 | Today Daily Change % | 0.08 |
| 3 | Today daily open | 1980.39 |
The pair remains strongly bullish on the daily timeframe. It trades above its 20 SMA @ 1920.57, 50 SMA 1892.23, 100 SMA @ 1850.77 and 200 SMA @ 1783.2.
| Trends | Trends.1 | |
|---|---|---|
| 0 | Daily SMA20 | 1920.57 |
| 1 | Daily SMA50 | 1892.23 |
| 2 | Daily SMA100 | 1850.77 |
| 3 | Daily SMA200 | 1783.20 |
The previous day high was 1984.37 while the previous day low was 1955.39. The daily 38.2% Fib levels comes at 1973.3, expected to provide support. Similarly, the daily 61.8% fib level is at 1966.46, expected to provide support.
Note the levels of interest below:
- Pivot support is noted at 1962.4, 1944.4, 1933.42
- Pivot resistance is noted at 1991.38, 2002.36, 2020.36
| Levels | Levels.1 |
|---|---|
| Previous Daily High | 1984.37 |
| Previous Daily Low | 1955.39 |
| Previous Weekly High | 2009.88 |
| Previous Weekly Low | 1934.34 |
| Previous Monthly High | 1959.80 |
| Previous Monthly Low | 1804.76 |
| Daily Fibonacci 38.2% | 1973.30 |
| Daily Fibonacci 61.8% | 1966.46 |
| Daily Pivot Point S1 | 1962.40 |
| Daily Pivot Point S2 | 1944.40 |
| Daily Pivot Point S3 | 1933.42 |
| Daily Pivot Point R1 | 1991.38 |
| Daily Pivot Point R2 | 2002.36 |
| Daily Pivot Point R3 | 2020.36 |
[/s2If]
Join Our Telegram Group


