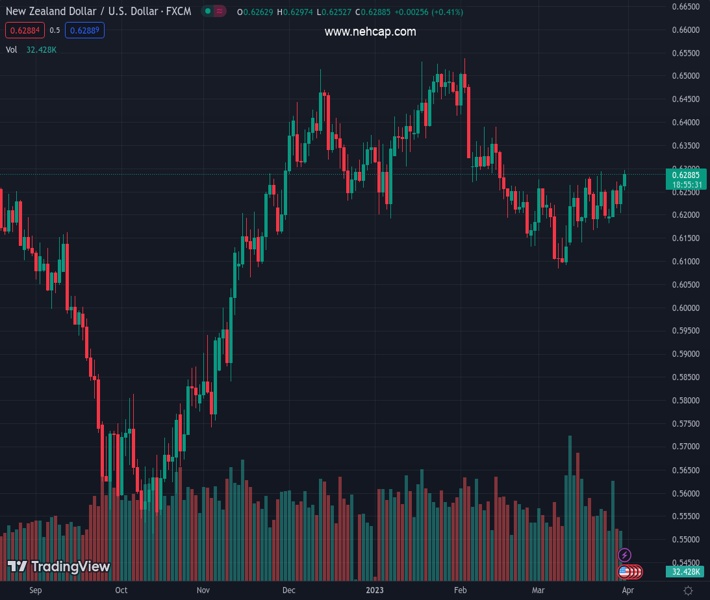
#NZDUSD @ 0.62894 takes the bids to refresh multi-day top on strong China PMI. (Pivot Orderbook analysis)
…
This is a premium post.
[s2If !current_user_can(access_s2member_level4)]Please register for PREMIUM VERSION HERE to read full post below containing analysis. In case of any error or you think you are not able to read the full post below, please email us at support#nehcap.com [lwa][/s2If] [s2If current_user_can(access_s2member_level4)]
- NZD/USD takes the bids to refresh multi-day top on strong China PMI.
- China’s NBS Manufacturing PMI, Non-Manufacturing PMI increased in March.
- Risk-on mood, receding hawkish Fed bets also favor Kiwi pair buyers.
- Fed’s preferred inflation gauge eyed for further directions.
The pair currently trades last at 0.62894.
The previous day high was 0.6267 while the previous day low was 0.6203. The daily 38.2% Fib levels comes at 0.6243, expected to provide support. Similarly, the daily 61.8% fib level is at 0.6227, expected to provide support.
NZD/USD renews the highest levels of the week, taking bids to refresh the multi-day top near 0.6300 on upbeat China activity data for March, published early Friday. Adding strength to the Kiwi pair’s upside is the broad US Dollar weakness amid receding hawkish Federal Reserve (Fed) bets and the mixed US data, not to forget the market’s cautious optimism.
China’s headline NBS Manufacturing PMI rises to 51.9 versus 51.5 expected and 52.6 prior while the Non-Manufacturing PMI jumps to 58.2 from 56.3 previous readings.
Elsewhere, Federal Reserve Chairman Jerome Powell joined three other Fed Officials to back further rate hikes on Thursday, citing the need to tame the inflation woes. However, mixed US data raise doubts about the Fed policymakers’ hawkish rhetoric and rather concentrated on their rejection of banking crisis woes to weigh on the US Dollar, as well the Fed bets. As a result, the CME’s FedWatch Tool suggests a nearly 50% chance of 0.25% rate hike in the May Fed meeting, versus 60% the previous day.
Not only the Fed talks but the mixed US data also weigh on the market’s bets of future rate hikes and propel the Kiwi pair. That said, final readings of the US fourth quarter (Q4) Gross Domestic Product (GDP), also known as the Real GDP, marked an easy Annualized growth number of 2.6% versus 2.7% previous forecasts. It’s worth noting that the Q4 Personal Consumption Expenditure (PCE) Prices matched 3.7% QoQ forecasts and prior while the Core PCE figure grew to 4.4% QoQ versus 4.3% expected and prior. Moving on, the Weekly Initial Jobless Claims rose to 198K for the week ended on March 25 versus 191K prior and 196K market forecasts.
It should be noted, however, that the Sino-American woes prod the NZD/USD bulls. China’s Taiwan Affairs Office threatened retaliation over Taiwan President Tsai Ing-wen’s visit to the US on Wednesday. Additionally, China’s Premier Li Qiang recently said that the economic situation in March is even better than in January and February. The policymaker, however, also raised geopolitical tension by opposing trade protectionism and decoupling, which indirectly targets the US.
Looking forward, Fed’s preferred inflation gauge, namely the US Core Personal Consumption Expenditure (PCE) Price Index for February, will be crucial for clear directions.
A clear upside break of the 50-DMA hurdle, now immediate support around 0.6280, keeps the Kiwi pair buyers hopeful.
Technical Levels: Supports and Resistances
NZDUSD currently trading at 0.6283 at the time of writing. Pair opened at 0.6263 and is trading with a change of 0.32% % .
| Overview | Overview.1 | |
|---|---|---|
| 0 | Today last price | 0.6283 |
| 1 | Today Daily Change | 0.0020 |
| 2 | Today Daily Change % | 0.32% |
| 3 | Today daily open | 0.6263 |
The pair is trading above its 20 Daily moving average @ 0.6202, below its 50 Daily moving average @ 0.6283 , below its 100 Daily moving average @ 0.6293 and above its 200 Daily moving average @ 0.6159
| Trends | Trends.1 | |
|---|---|---|
| 0 | Daily SMA20 | 0.6202 |
| 1 | Daily SMA50 | 0.6283 |
| 2 | Daily SMA100 | 0.6293 |
| 3 | Daily SMA200 | 0.6159 |
The previous day high was 0.6267 while the previous day low was 0.6203. The daily 38.2% Fib levels comes at 0.6243, expected to provide support. Similarly, the daily 61.8% fib level is at 0.6227, expected to provide support.
Note the levels of interest below:
- Pivot support is noted at 0.6222, 0.618, 0.6158
- Pivot resistance is noted at 0.6286, 0.6308, 0.635
| Levels | Levels.1 |
|---|---|
| Previous Daily High | 0.6267 |
| Previous Daily Low | 0.6203 |
| Previous Weekly High | 0.6295 |
| Previous Weekly Low | 0.6167 |
| Previous Monthly High | 0.6538 |
| Previous Monthly Low | 0.6131 |
| Daily Fibonacci 38.2% | 0.6243 |
| Daily Fibonacci 61.8% | 0.6227 |
| Daily Pivot Point S1 | 0.6222 |
| Daily Pivot Point S2 | 0.6180 |
| Daily Pivot Point S3 | 0.6158 |
| Daily Pivot Point R1 | 0.6286 |
| Daily Pivot Point R2 | 0.6308 |
| Daily Pivot Point R3 | 0.6350 |
[/s2If]
Join Our Telegram Group


