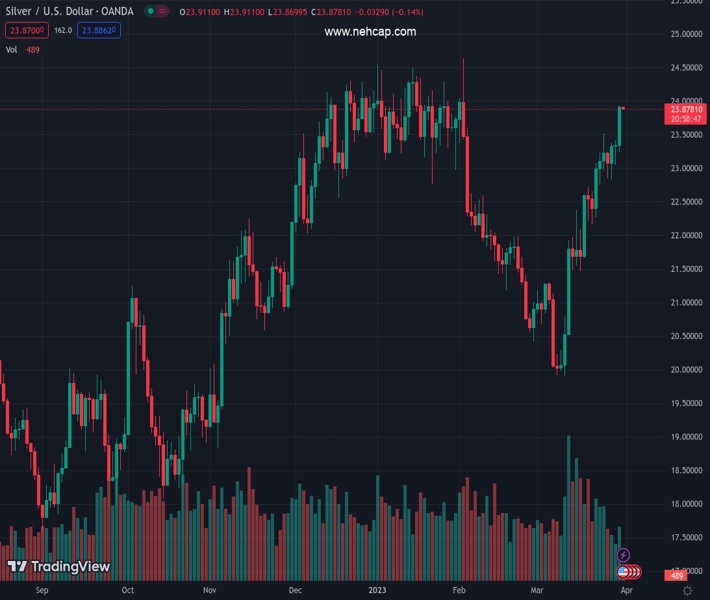
#XAGUSD @ 23.875 Silver price is aiming to recapture the immediate resistance of $24.00 amid a positive market mood. (Pivot Orderbook analysis)
…
This is a premium post.
[s2If !current_user_can(access_s2member_level4)]Please register for PREMIUM VERSION HERE to read full post below containing analysis. In case of any error or you think you are not able to read the full post below, please email us at support#nehcap.com [lwa][/s2If] [s2If current_user_can(access_s2member_level4)]
- Silver price is aiming to recapture the immediate resistance of $24.00 amid a positive market mood.
- The white metal is in a positive trajectory despite receding fears of potential United States banking turmoil.
- Silver price is auctioning in a Rising Wedge chart pattern that indicates a continuation of upside momentum.
The pair currently trades last at 23.875.
The previous day high was 23.42 while the previous day low was 23.05. The daily 38.2% Fib levels comes at 23.28, expected to provide support. Similarly, the daily 61.8% fib level is at 23.19, expected to provide support.
Silver price (XAG/USD) is marching towards the round-level resistance of $24.00 with an immense pace in the early Asian session. The white metal has registered a three-day winning streak and is expected to continue its upside momentum amid weakness in the US Dollar Index (DXY).
Silver price is in a positive trajectory despite receding fears of potential United States banking turmoil. Earlier, investors underpinned bullions as a safe-haven to dodge volatility-inspired by the collapse of three mid-size US banks.
The USD index is struggling to gain strength despite rising chances of more rate hikes by the Federal Reserve (Fed). One school of thought believes that Fed chair Jerome Powell could go for hiking rates further as US banking jitters are cooling-off. Also, Fed Powell has anticipated one more rate hike in 2023. And that a rate hike in Fed’s May policy meeting would allow it to keep rates higher for a longer period.
Meanwhile, S&P500 futures have added more gains in the Asian session after a positive settlement on Thursday, indicating sheer improvement in the risk-taking ability of the market participants.
Going forward, Fed’s preferred inflation tool, the US core Personal Consumption Expenditure (PCE) Price Index data will remain in the spotlight. Analysts at Credit Suisse expect “Monthly reading to just round down to 0.3%, leaving YoY core inflation unchanged at 4.7%. Monthly headline inflation should be similar to the core, but the YoY measure should drop to 5.1% owing to an easy base effect.”
Silver price is auctioning in a Rising Wedge chart pattern that indicates a continuation of upside momentum and every pullback is considered as a buying opportunity for the market participants. The white metal is approaching the horizontal resistance plotted from February 02 high at $24.64. The 20-period Exponential Moving Average (EMA) at $23.14 is providing a cushion to the Silver price.
The Relative Strength Index (RSI) (14) is oscillating in the bullish range of 60.00-80.00, which indicates more upside ahead.
Technical Levels: Supports and Resistances
XAGUSD currently trading at 23.89 at the time of writing. Pair opened at 23.34 and is trading with a change of 2.36 % .
| Overview | Overview.1 | |
|---|---|---|
| 0 | Today last price | 23.89 |
| 1 | Today Daily Change | 0.55 |
| 2 | Today Daily Change % | 2.36 |
| 3 | Today daily open | 23.34 |
The pair remains strongly bullish on the daily timeframe. It trades above its 20 SMA @ 21.88, 50 SMA 22.2, 100 SMA @ 22.55 and 200 SMA @ 21.0.
| Trends | Trends.1 | |
|---|---|---|
| 0 | Daily SMA20 | 21.88 |
| 1 | Daily SMA50 | 22.20 |
| 2 | Daily SMA100 | 22.55 |
| 3 | Daily SMA200 | 21.00 |
The previous day high was 23.42 while the previous day low was 23.05. The daily 38.2% Fib levels comes at 23.28, expected to provide support. Similarly, the daily 61.8% fib level is at 23.19, expected to provide support.
Note the levels of interest below:
- Pivot support is noted at 23.12, 22.9, 22.75
- Pivot resistance is noted at 23.49, 23.64, 23.86
| Levels | Levels.1 |
|---|---|
| Previous Daily High | 23.42 |
| Previous Daily Low | 23.05 |
| Previous Weekly High | 23.52 |
| Previous Weekly Low | 22.16 |
| Previous Monthly High | 24.64 |
| Previous Monthly Low | 20.42 |
| Daily Fibonacci 38.2% | 23.28 |
| Daily Fibonacci 61.8% | 23.19 |
| Daily Pivot Point S1 | 23.12 |
| Daily Pivot Point S2 | 22.90 |
| Daily Pivot Point S3 | 22.75 |
| Daily Pivot Point R1 | 23.49 |
| Daily Pivot Point R2 | 23.64 |
| Daily Pivot Point R3 | 23.86 |
[/s2If]
Join Our Telegram Group


