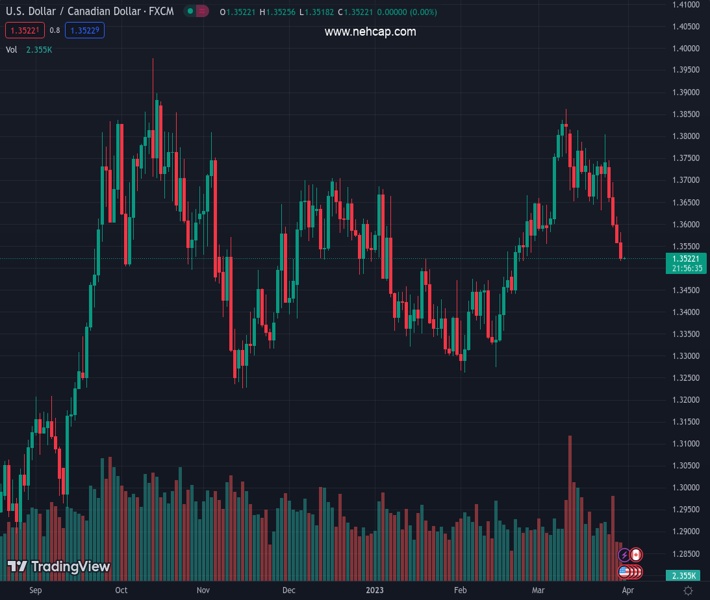
#USDCAD @ 1.35200 has registered a four-day losing streak amid a declining USD Index. (Pivot Orderbook analysis)
…
This is a premium post.
[s2If !current_user_can(access_s2member_level4)]Please register for PREMIUM VERSION HERE to read full post below containing analysis. In case of any error or you think you are not able to read the full post below, please email us at support#nehcap.com [lwa][/s2If] [s2If current_user_can(access_s2member_level4)]
- USD/CAD has registered a four-day losing streak amid a declining USD Index.
- S&P500 continued its upside momentum as investors are cheering ebbing fears of the potential banking crisis.
- Canada’s monthly GDP (Jan) is expected to expand by 0.3% vs. a contraction of 0.1%.
The pair currently trades last at 1.35200.
The previous day high was 1.3617 while the previous day low was 1.3557. The daily 38.2% Fib levels comes at 1.358, expected to provide resistance. Similarly, the daily 61.8% fib level is at 1.3594, expected to provide resistance.
The USD/CAD pair has refreshed its five-week low below 1.3516 in the early Asian session amid weakness in the US Dollar Index (DXY) and rising oil prices. The Loonie asset has turned sideways after a four-day losing streak and is looking vulnerable above 1.3510. The USD Index witnessed an intense sell-off on Thursday after surrendering the critical support of 102.40. Less room for further upside in interest rates by the Federal Reserve (Fed) has built bearish bets for the USD Index.
S&P500 futures continued their upside momentum on Thursday as investors are cheering ebbing fears of a potential banking crisis, portraying a significant jump in the risk appetite of market participants.
The demand for US government bonds remained choppy as investors don’t see more casualties to the banking system. However, the 10-year US treasury yields surrendered their entire gains and settled Thursday’s session below 3.55%.
Going forward, the United States’ core Personal Consumption Expenditure (PCE) Price Index data will remain in the spotlight. Analysts at CIBC expect “The Fed’s preferred gauge of inflation, core PCE prices, likely decelerated to a 0.4% monthly pace, slightly slower than its CPI counterpart given the lower weight of shelter in the index, but still too hot to reach on-target inflation, and justifying the Fed’s decision to raise rates further in March. We are roughly in line with the consensus, which should limit any market reaction.”
The Canadian Dollar will dance to the tunes of monthly Canada’s Gross Domestic Product (GDP) (Jan) data. As per the consensus, the economic data will expand by 0.3% vs. a contraction of 0.1%.
On the oil front, oil prices rose sharply above $74.00 in hopes that fewer rate hikes from western central banks collaboratively will strengthen the overall oil demand ahead. It is worth noting that Canada is the leading exporter of oil to the United States and higher oil prices will support the Canadian Dollar.
Technical Levels: Supports and Resistances
USDCAD currently trading at 1.3522 at the time of writing. Pair opened at 1.3559 and is trading with a change of -0.27 % .
| Overview | Overview.1 | |
|---|---|---|
| 0 | Today last price | 1.3522 |
| 1 | Today Daily Change | -0.0037 |
| 2 | Today Daily Change % | -0.2700 |
| 3 | Today daily open | 1.3559 |
The pair is trading below its 20 Daily moving average @ 1.3702, below its 50 Daily moving average @ 1.3539 , above its 100 Daily moving average @ 1.3517 and above its 200 Daily moving average @ 1.3369
| Trends | Trends.1 | |
|---|---|---|
| 0 | Daily SMA20 | 1.3702 |
| 1 | Daily SMA50 | 1.3539 |
| 2 | Daily SMA100 | 1.3517 |
| 3 | Daily SMA200 | 1.3369 |
The previous day high was 1.3617 while the previous day low was 1.3557. The daily 38.2% Fib levels comes at 1.358, expected to provide resistance. Similarly, the daily 61.8% fib level is at 1.3594, expected to provide resistance.
Note the levels of interest below:
- Pivot support is noted at 1.3538, 1.3517, 1.3478
- Pivot resistance is noted at 1.3598, 1.3637, 1.3658
| Levels | Levels.1 |
|---|---|
| Previous Daily High | 1.3617 |
| Previous Daily Low | 1.3557 |
| Previous Weekly High | 1.3804 |
| Previous Weekly Low | 1.3631 |
| Previous Monthly High | 1.3666 |
| Previous Monthly Low | 1.3262 |
| Daily Fibonacci 38.2% | 1.3580 |
| Daily Fibonacci 61.8% | 1.3594 |
| Daily Pivot Point S1 | 1.3538 |
| Daily Pivot Point S2 | 1.3517 |
| Daily Pivot Point S3 | 1.3478 |
| Daily Pivot Point R1 | 1.3598 |
| Daily Pivot Point R2 | 1.3637 |
| Daily Pivot Point R3 | 1.3658 |
[/s2If]
Join Our Telegram Group


