#USDCHF @ 0.91310 dropped after facing the 20-day EMA and a resistance trendline, extending its losses for two straight days (Pivot Orderbook analysis)
…
This is a premium post.
[s2If !current_user_can(access_s2member_level4)]Please register for PREMIUM VERSION HERE to read full post below containing analysis. In case of any error or you think you are not able to read the full post below, please email us at support#nehcap.com [lwa][/s2If] [s2If current_user_can(access_s2member_level4)]
- USD/CHF dropped after facing the 20-day EMA and a resistance trendline, extending its losses for two straight days
- USD/CHF Price Analysis: Short term, a triple bottom could cap the pair’s fall and open the door to test 0.9300.
The pair currently trades last at 0.91310.
The previous day high was 0.9224 while the previous day low was 0.9165. The daily 38.2% Fib levels comes at 0.9187, expected to provide resistance. Similarly, the daily 61.8% fib level is at 0.9201, expected to provide resistance.
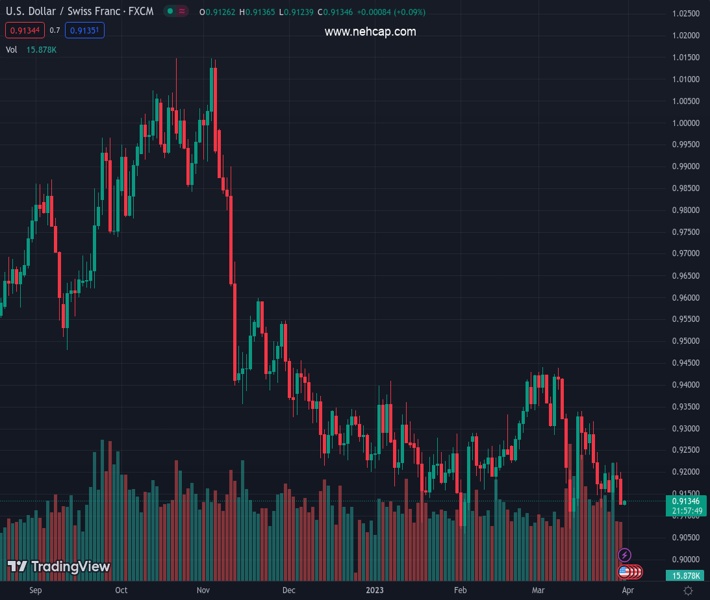
After facing a resistance trendline, which intersects with the 20-day Exponential Moving Average (EMA), the USD/CHF dropped and extended its losses for two straight days. At the time of writing, the USD/CHF is trading at 0.9133, up 0.08%, as Friday’s Asian session begins.
The USD/CHF slid from the 0.9200 mark as the US Dollar (USD) weakened across the FX board. Furthermore, the USD/CHF pair is downward biased, though to further cement its bearish case, the major needs to break below the March 13 swing low at 0.9070. Once cleared, the USD/CHF pair would test the YTD lows at 0.9059, which, once cleared, could open the door towards 0.9000. On the flip side, buyers reclaim the 20-day EMA at 0.9215, and the major could test 0.9300.
Short term, the USD/CHF4-hour chart portrays a triple bottom forming, though it is at the brisk of being invalidated if the spot price tumbles and extends below 0.9118. If buyers keep the price above the latter, the chart pattern will remain in play. If the USD/CHF breaks above the daily pivot at 0.9150, the next resistance would be 0.9180, followed by March 30 high at 0.9200. Once cleared, the next reistace would be the 100-EMA at 0.9218, ahead of the 200-EMA at 0.9244.
In an alternate scenario, if the USD/CHF pair dwindles below 0.9118, that would pave the way to test the YTD low at 0.9059.
Technical Levels: Supports and Resistances
USDCHF currently trading at 0.9133 at the time of writing. Pair opened at 0.9185 and is trading with a change of -0.57 % .
| Overview | Overview.1 | |
|---|---|---|
| 0 | Today last price | 0.9133 |
| 1 | Today Daily Change | -0.0052 |
| 2 | Today Daily Change % | -0.5700 |
| 3 | Today daily open | 0.9185 |
The pair remains strongly bearish on the daily time frame. It trades below the 20 SMA @ 0.9261, 50 SMA 0.9252, 100 SMA @ 0.9305 and 200 SMA @ 0.9524.
| Trends | Trends.1 | |
|---|---|---|
| 0 | Daily SMA20 | 0.9261 |
| 1 | Daily SMA50 | 0.9252 |
| 2 | Daily SMA100 | 0.9305 |
| 3 | Daily SMA200 | 0.9524 |
The previous day high was 0.9224 while the previous day low was 0.9165. The daily 38.2% Fib levels comes at 0.9187, expected to provide resistance. Similarly, the daily 61.8% fib level is at 0.9201, expected to provide resistance.
Note the levels of interest below:
- Pivot support is noted at 0.9159, 0.9133, 0.91
- Pivot resistance is noted at 0.9217, 0.925, 0.9276
| Levels | Levels.1 |
|---|---|
| Previous Daily High | 0.9224 |
| Previous Daily Low | 0.9165 |
| Previous Weekly High | 0.9317 |
| Previous Weekly Low | 0.9120 |
| Previous Monthly High | 0.9429 |
| Previous Monthly Low | 0.9059 |
| Daily Fibonacci 38.2% | 0.9187 |
| Daily Fibonacci 61.8% | 0.9201 |
| Daily Pivot Point S1 | 0.9159 |
| Daily Pivot Point S2 | 0.9133 |
| Daily Pivot Point S3 | 0.9100 |
| Daily Pivot Point R1 | 0.9217 |
| Daily Pivot Point R2 | 0.9250 |
| Daily Pivot Point R3 | 0.9276 |
[/s2If]
Join Our Telegram Group


