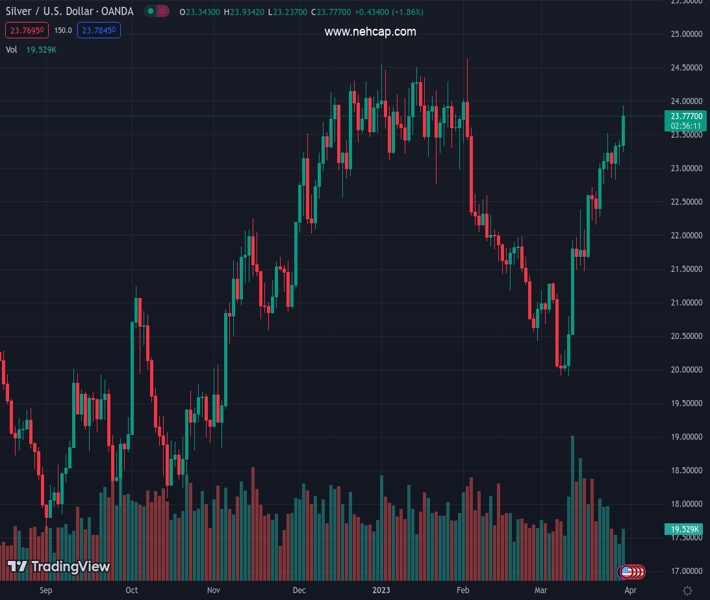
#XAGUSD @ 23.775 is upward biased from a daily chart perspective, and it might test the YTD high at $24.63. (Pivot Orderbook analysis)
…
This is a premium post.
[s2If !current_user_can(access_s2member_level4)]Please register for PREMIUM VERSION HERE to read full post below containing analysis. In case of any error or you think you are not able to read the full post below, please email us at support#nehcap.com [lwa][/s2If] [s2If current_user_can(access_s2member_level4)]
- XAG/USD is upward biased from a daily chart perspective, and it might test the YTD high at $24.63.
- XAG/USD is in a solid uptrend, supported by oscillators at bullish territory.
- XAG/USD may experience a downside if it falls below $23.50, as it could drop toward the S1 pivot point.
The pair currently trades last at 23.775.
The previous day high was 23.42 while the previous day low was 23.05. The daily 38.2% Fib levels comes at 23.28, expected to provide support. Similarly, the daily 61.8% fib level is at 23.19, expected to provide support.
Silver price broke a two-month resistance trendline, reaching a new 8-week high of $23.92 due to overall US Dollar (USD) weakness and falling US Treasury bond yields. Therefore, the XAG/USD is trading at $23.74, up more than 2%, after hitting a low of $23.24.
From a daily chart perspective, the XAG/USD is upward biased and might soon test the YTD high at $24.63 once it reclaimed the $23.50 figure. But firstly, Silver buyers need to reclaim the $24.00 figure, ahead of challenging YTD highs. The Relative Strength Index (RSI) at overbought conditions continues to aim higher, while the Rate of Change (RoC) portrays buyers in charge. If XAG/USD fails to break $24.00, that could pave the way for a pullback.
In the short term, the XAG/USD 4-hour chart portrays the white metal in a solid uptrend, testing the R3 daily pivot point at $23.83 after hitting a daily high of $23.92. If the XAG/USD conquers $24.00, that will expose the YTD high. The Relative Strength Index (RSI) justifies an upward continuation at bullish territory, while the Rate of Change (RoC) does it too.
On the flip side, if the XAG/USD stumbles beneath the R2’s daily pivot at $23.62, it would pave the way for further downside. Hence, the XAG/USD first support would be the R1 pivot point at $23.47, followed by the intersection of the 20-EMA and the daily pivot point at $23.30, before diving towards the S1 pivot point at $23.11.
Technical Levels: Supports and Resistances
XAGUSD currently trading at 23.81 at the time of writing. Pair opened at 23.34 and is trading with a change of 2.01 % .
| Overview | Overview.1 | |
|---|---|---|
| 0 | Today last price | 23.81 |
| 1 | Today Daily Change | 0.47 |
| 2 | Today Daily Change % | 2.01 |
| 3 | Today daily open | 23.34 |
The pair remains strongly bullish on the daily timeframe. It trades above its 20 SMA @ 21.88, 50 SMA 22.2, 100 SMA @ 22.55 and 200 SMA @ 21.0.
| Trends | Trends.1 | |
|---|---|---|
| 0 | Daily SMA20 | 21.88 |
| 1 | Daily SMA50 | 22.20 |
| 2 | Daily SMA100 | 22.55 |
| 3 | Daily SMA200 | 21.00 |
The previous day high was 23.42 while the previous day low was 23.05. The daily 38.2% Fib levels comes at 23.28, expected to provide support. Similarly, the daily 61.8% fib level is at 23.19, expected to provide support.
Note the levels of interest below:
- Pivot support is noted at 23.12, 22.9, 22.75
- Pivot resistance is noted at 23.49, 23.64, 23.86
| Levels | Levels.1 |
|---|---|
| Previous Daily High | 23.42 |
| Previous Daily Low | 23.05 |
| Previous Weekly High | 23.52 |
| Previous Weekly Low | 22.16 |
| Previous Monthly High | 24.64 |
| Previous Monthly Low | 20.42 |
| Daily Fibonacci 38.2% | 23.28 |
| Daily Fibonacci 61.8% | 23.19 |
| Daily Pivot Point S1 | 23.12 |
| Daily Pivot Point S2 | 22.90 |
| Daily Pivot Point S3 | 22.75 |
| Daily Pivot Point R1 | 23.49 |
| Daily Pivot Point R2 | 23.64 |
| Daily Pivot Point R3 | 23.86 |
[/s2If]
Join Our Telegram Group
")


