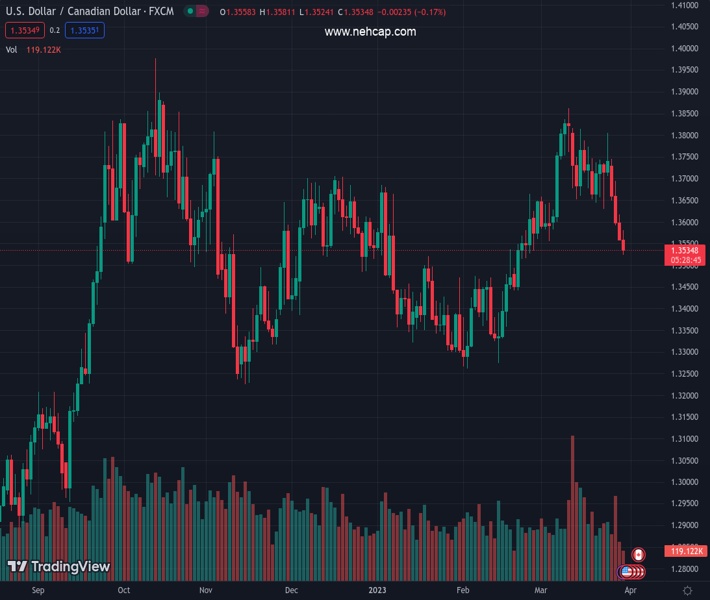
#USDCAD @ 1.35312 approaches the 100-day EMA at 1.3520, yet shy of testing it. (Pivot Orderbook analysis)
…
This is a premium post.
[s2If !current_user_can(access_s2member_level4)]Please register for PREMIUM VERSION HERE to read full post below containing analysis. In case of any error or you think you are not able to read the full post below, please email us at support#nehcap.com [lwa][/s2If] [s2If current_user_can(access_s2member_level4)]
- USD/CAD approaches the 100-day EMA at 1.3520, yet shy of testing it.
- US Bureau of Labor Statistics (BLS) reveals unemployment claims rise above estimates.
- US GDP for Q4 2022 slides a tick below expectations at 2.6%.
The pair currently trades last at 1.35312.
The previous day high was 1.3617 while the previous day low was 1.3557. The daily 38.2% Fib levels comes at 1.358, expected to provide resistance. Similarly, the daily 61.8% fib level is at 1.3594, expected to provide resistance.
USD/CAD stumbles below the 50-day Exponential Moving Average (EMA) spurred by a risk-on impulse, as shown by Wall Street opening in the green. Market participants estimated that the US Federal Reserve (Fed) would not hike rates at the May meeting while the buck weakens. At the time of typing, the USD/CAD is trading at 1.3528, below its opening price by 0.22%.
The Canadian Dollar (CAD) strengthened for the fourth straight day, with the USD/CAD tumbling below 1.3600 for the first time since March 7. The greenback’s fall continued after the US Bureau of Labor Statistics (BLS) revealed unemployment claims. Initial Jobless Claims for the week ending on March 25 rose 198K, above estimates of 196K.
At the same time, the US Commerce Department revealed the Gross Domestic Product (GDP) for Q4 2022 on its final reading, it came a tick below 2.7% estimates, at 2.6%
The US labor market data is a relief for the Federal Reserve, as the central bank is trying to curb stickier inflation levels above 6%. If the labor market continues to cool down, that will ease inflationary pressures. Nevertheless, the Fed’s preferred gauge for inflation will be revealed on Friday. The Core Personal Consumption Expenditure (PCE) is estimated at 4.7% YoY. Readings above the consensus could open the door for additional rate increases, meaning that the US Dollar (USD) could appreciate in the near term; hence further upside in the USD/CAD can be expected.
Nevertheless, the USD/CAD has held below 1.3600 on rising oil prices. WTI, the US crude oil benchmark, is increasing 1.88%, at $74.16 PB, a headwind for the USD/CAD. A good part of Canada’s economic growth is linked to oil and natural gas exports.
On the Canadian side, January’s Gross Domestic Product (GDP) is expected at 0.3% MoM. Analysts at TD Securities noted, “We look for industry-level GDP to rise by 0.4% m/m in January, in line with the market consensus and slightly above flash estimates for a 0.3% gain. Details should reveal broad-based strength across goods and services, and if realized, our forecast would leave Q1 GDP tracking further above BoC projections of 0.5%.”
Despite the recent four-day pullback, the USD/CAD is still neutrally biased. Sellers need to drag prices below the 50-day EMA at 1.3520, which would open the door to testing 1.3500. Further downside below the figure will expose the 200-day EMA at 1.3369. But if USD/CAD buyers step in around 1.3500, the USD/CAD could test the 20-day EMA at 1.3648 in the short term.
Technical Levels: Supports and Resistances
USDCAD currently trading at 1.3539 at the time of writing. Pair opened at 1.3559 and is trading with a change of -0.15 % .
| Overview | Overview.1 | |
|---|---|---|
| 0 | Today last price | 1.3539 |
| 1 | Today Daily Change | -0.0020 |
| 2 | Today Daily Change % | -0.1500 |
| 3 | Today daily open | 1.3559 |
The pair is trading below its 20 Daily moving average @ 1.3702, below its 50 Daily moving average @ 1.3539 , above its 100 Daily moving average @ 1.3517 and above its 200 Daily moving average @ 1.3369
| Trends | Trends.1 | |
|---|---|---|
| 0 | Daily SMA20 | 1.3702 |
| 1 | Daily SMA50 | 1.3539 |
| 2 | Daily SMA100 | 1.3517 |
| 3 | Daily SMA200 | 1.3369 |
The previous day high was 1.3617 while the previous day low was 1.3557. The daily 38.2% Fib levels comes at 1.358, expected to provide resistance. Similarly, the daily 61.8% fib level is at 1.3594, expected to provide resistance.
Note the levels of interest below:
- Pivot support is noted at 1.3538, 1.3517, 1.3478
- Pivot resistance is noted at 1.3598, 1.3637, 1.3658
| Levels | Levels.1 |
|---|---|
| Previous Daily High | 1.3617 |
| Previous Daily Low | 1.3557 |
| Previous Weekly High | 1.3804 |
| Previous Weekly Low | 1.3631 |
| Previous Monthly High | 1.3666 |
| Previous Monthly Low | 1.3262 |
| Daily Fibonacci 38.2% | 1.3580 |
| Daily Fibonacci 61.8% | 1.3594 |
| Daily Pivot Point S1 | 1.3538 |
| Daily Pivot Point S2 | 1.3517 |
| Daily Pivot Point S3 | 1.3478 |
| Daily Pivot Point R1 | 1.3598 |
| Daily Pivot Point R2 | 1.3637 |
| Daily Pivot Point R3 | 1.3658 |
[/s2If]
Join Our Telegram Group
")


