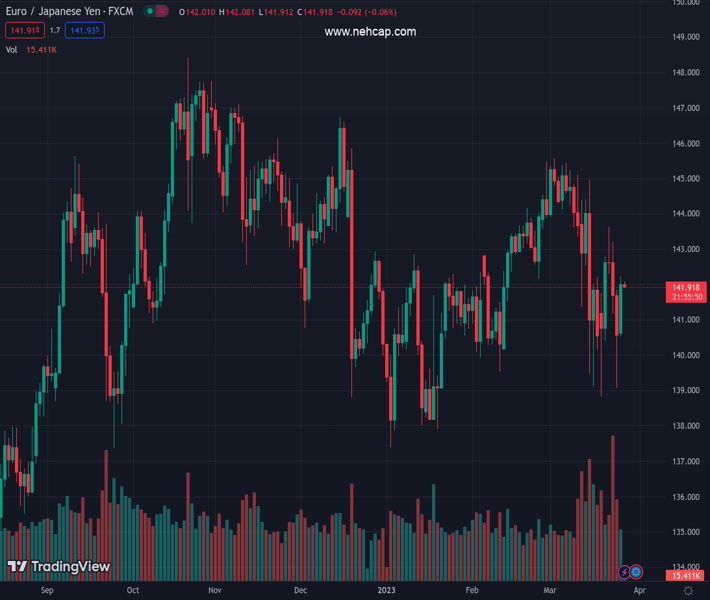
#EURJPY @ 141.934 turns bullish as it forms a double bottom and a bullish engulfing candle pattern. (Pivot Orderbook analysis)
…
This is a premium post.
[s2If !current_user_can(access_s2member_level4)]Please register for PREMIUM VERSION HERE to read full post below containing analysis. In case of any error or you think you are not able to read the full post below, please email us at support#nehcap.com [lwa][/s2If] [s2If current_user_can(access_s2member_level4)]
- EUR/JPY turns bullish as it forms a double bottom and a bullish engulfing candle pattern.
- Short term, the EUR/JPY is neutrally biased, trapped within the EMAs.
- EUR/JPY Price Analysis: Bullish above 142.00; otherwise would turn downwards.
The pair currently trades last at 141.934.
The previous day high was 141.85 while the previous day low was 139.07. The daily 38.2% Fib levels comes at 140.13, expected to provide support. Similarly, the daily 61.8% fib level is at 140.79, expected to provide support.
EUR/JPY rallied sharply on Monday and formed a bullish engulfing candle chart pattern. A double bottom takes shape as the EUR/JPY is poised to test solid resistance at around the 142.29-47 area. At the time of writing, the EUR/JPY is trading at 142.03.
The EUR/JPY daily chart is neutral to upward biased. Nevertheless, the last few days’ price action has opened the door for further gains. Oscillators are mixed, with the Relative Strength Index (RSI) flat at bearish territory, while the Rate of Change (RoC) jumped on Monday’s trading session. Therefore, mixed signals could keep EUR/JPY traders at bay.
Short term, the EUR/JPY climb is pausing nearby the 142.00 mark. The EUR/JPY drew a doji, indicating that buyers/sellers are at equilibrium while oscillators remain bullish. The Relative Strength Index (RSI) at 54 turned flat, while the Rate of Change (RoC) was neutral. Therefore, the EUR/JPY might trade sideways before resuming upwards or downwards.
If the EUR/JPY cracks the 142.00 figure, the pair will test the 100-EMA at 142.35. A breach of the latter will expose the 142.54 as the pair sets to test the 143.00 mark.
On the flip side, the EUR/JPY first support would be the 50-EMA at 141.88. Once cleared, the pair would tumble to the confluence of the 20-EMA and the pivot point at 141.58 before testing 141.00.
Technical Levels: Supports and Resistances
EURJPY currently trading at 141.99 at the time of writing. Pair opened at 140.64 and is trading with a change of 0.96 % .
| Overview | Overview.1 | |
|---|---|---|
| 0 | Today last price | 141.99 |
| 1 | Today Daily Change | 1.35 |
| 2 | Today Daily Change % | 0.96 |
| 3 | Today daily open | 140.64 |
The pair is trading below its 20 Daily moving average @ 143.22, below its 50 Daily moving average @ 142.24 , below its 100 Daily moving average @ 142.66 and above its 200 Daily moving average @ 141.84
| Trends | Trends.1 | |
|---|---|---|
| 0 | Daily SMA20 | 143.22 |
| 1 | Daily SMA50 | 142.24 |
| 2 | Daily SMA100 | 142.66 |
| 3 | Daily SMA200 | 141.84 |
The previous day high was 141.85 while the previous day low was 139.07. The daily 38.2% Fib levels comes at 140.13, expected to provide support. Similarly, the daily 61.8% fib level is at 140.79, expected to provide support.
Note the levels of interest below:
- Pivot support is noted at 139.19, 137.74, 136.41
- Pivot resistance is noted at 141.97, 143.3, 144.74
| Levels | Levels.1 |
|---|---|
| Previous Daily High | 141.85 |
| Previous Daily Low | 139.07 |
| Previous Weekly High | 143.63 |
| Previous Weekly Low | 138.83 |
| Previous Monthly High | 145.47 |
| Previous Monthly Low | 139.55 |
| Daily Fibonacci 38.2% | 140.13 |
| Daily Fibonacci 61.8% | 140.79 |
| Daily Pivot Point S1 | 139.19 |
| Daily Pivot Point S2 | 137.74 |
| Daily Pivot Point S3 | 136.41 |
| Daily Pivot Point R1 | 141.97 |
| Daily Pivot Point R2 | 143.30 |
| Daily Pivot Point R3 | 144.74 |
[/s2If]
Join Our Telegram Group


