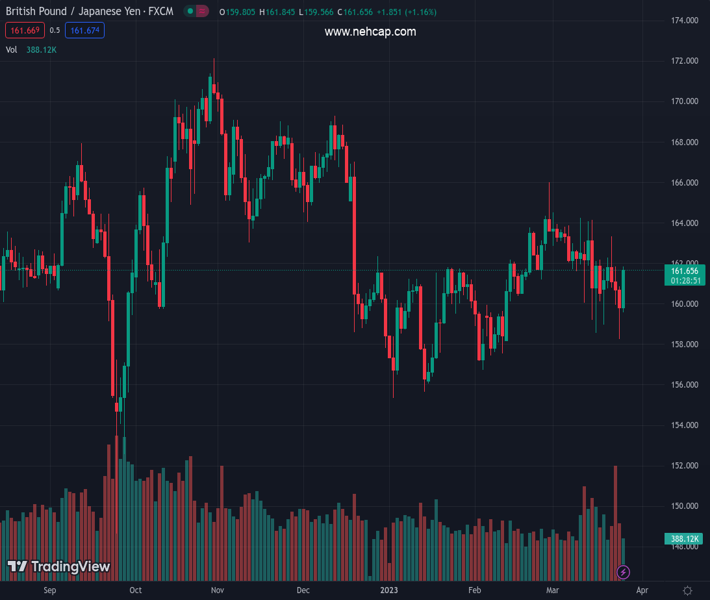
#GBPJPY @ 161.668 rises and trades above the 20 and 50-day EMAs, reflecting a gain of 1.18%. (Pivot Orderbook analysis)
…
This is a premium post.
[s2If !current_user_can(access_s2member_level4)]Please register for PREMIUM VERSION HERE to read full post below containing analysis. In case of any error or you think you are not able to read the full post below, please email us at support#nehcap.com [lwa][/s2If] [s2If current_user_can(access_s2member_level4)]
- GBP/JPY rises and trades above the 20 and 50-day EMAs, reflecting a gain of 1.18%.
- The pair formed a bullish engulfing candle pattern, with oscillators favoring the upside in the daily chart.
- GBP/JPY Price Analysis: In the short term might test 160.00 unless buyers reclaim 162.00.
The pair currently trades last at 161.668.
The previous day high was 160.86 while the previous day low was 158.27. The daily 38.2% Fib levels comes at 159.26, expected to provide support. Similarly, the daily 61.8% fib level is at 159.87, expected to provide support.
GBP/JPY pops after three days of losses, and trades above the 20 and 50-day Exponential Moving Averages (EMAs), sitting at 161.54 and 161.59, respectively. After hitting a daily low of 159.56, the GBP/JPY is trading at 161.68, gaining 1.18%.
Friday’s price action portrayed a hammer preceded by a downtrend, meaning that the GBP/JPY might print a leg-up. On Monday, the GBP/JPY resumed its uptrend, forming a bullish engulfing candle pattern, favoring the upside in the cross-currency pair. The Relative Strength Index (RSI) also shifted bullish, while the Rate of Change (RoC) jumped from neutral.
From an intraday perspective, the GBP/JPY 4-hour chart portrays the pair as neutral to downward biased facing the confluence of the 100 and 200-EMAs, around 161.52/58. A decisive break and the GBP/JPY could rally to 162.00, followed by the R2 daily pivot point at 162.22. Upside risks lie at a 5-month-old downslope trendline at around 162.50-60, followed by a March 23 daily high test at 163.33.
On the other hand, and the GBP/JPY path of least resistance in the near term, the first support would be the 50-EMA at 161.14, immediately followed by the R1 daily pivot at 161.01. Once hurdle, the pair might fall to the 20-EMA at 160.78, followed by a dip to the central pivot at 159.63.
Technical Levels: Supports and Resistances
GBPJPY currently trading at 161.66 at the time of writing. Pair opened at 159.9 and is trading with a change of 1.1 % .
| Overview | Overview.1 | |
|---|---|---|
| 0 | Today last price | 161.66 |
| 1 | Today Daily Change | 1.76 |
| 2 | Today Daily Change % | 1.10 |
| 3 | Today daily open | 159.90 |
The pair is trading below its 20 Daily moving average @ 162.26, above its 50 Daily moving average @ 161.05 , below its 100 Daily moving average @ 162.53 and below its 200 Daily moving average @ 163.25
| Trends | Trends.1 | |
|---|---|---|
| 0 | Daily SMA20 | 162.26 |
| 1 | Daily SMA50 | 161.05 |
| 2 | Daily SMA100 | 162.53 |
| 3 | Daily SMA200 | 163.25 |
The previous day high was 160.86 while the previous day low was 158.27. The daily 38.2% Fib levels comes at 159.26, expected to provide support. Similarly, the daily 61.8% fib level is at 159.87, expected to provide support.
Note the levels of interest below:
- Pivot support is noted at 158.49, 157.09, 155.91
- Pivot resistance is noted at 161.08, 162.26, 163.67
| Levels | Levels.1 |
|---|---|
| Previous Daily High | 160.86 |
| Previous Daily Low | 158.27 |
| Previous Weekly High | 163.34 |
| Previous Weekly Low | 158.27 |
| Previous Monthly High | 166.01 |
| Previous Monthly Low | 156.73 |
| Daily Fibonacci 38.2% | 159.26 |
| Daily Fibonacci 61.8% | 159.87 |
| Daily Pivot Point S1 | 158.49 |
| Daily Pivot Point S2 | 157.09 |
| Daily Pivot Point S3 | 155.91 |
| Daily Pivot Point R1 | 161.08 |
| Daily Pivot Point R2 | 162.26 |
| Daily Pivot Point R3 | 163.67 |
[/s2If]
Join Our Telegram Group


