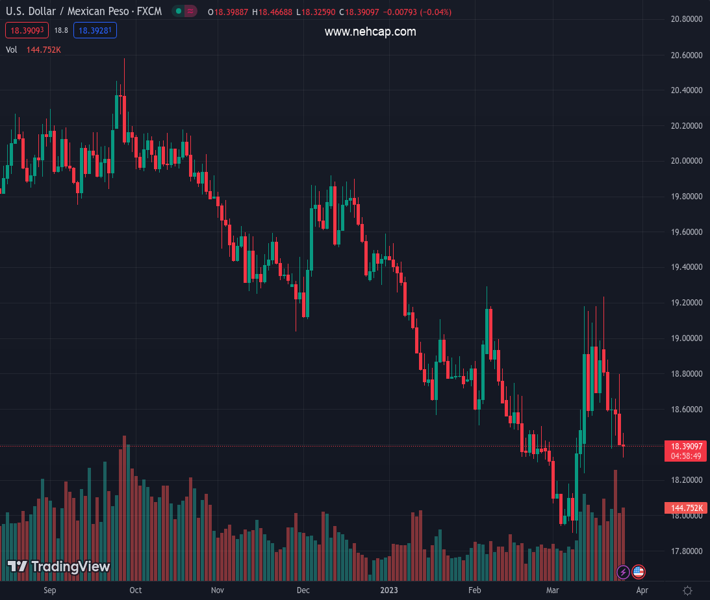
#USDMXN @ 18.3937 prints losses below $18.40 spurred on risk appetite despite high UST bond yields. (Pivot Orderbook analysis)
…
This is a premium post.
[s2If !current_user_can(access_s2member_level4)]Please register for PREMIUM VERSION HERE to read full post below containing analysis. In case of any error or you think you are not able to read the full post below, please email us at support#nehcap.com [lwa][/s2If] [s2If current_user_can(access_s2member_level4)]
- USD/MXN prints losses below $18.40 spurred on risk appetite despite high UST bond yields.
- US recession risks had risen, according to Minnesota’s Fed President Kashkari.
- USD/MXN Price Analysis: To continue its downtrend below 18.7968.
The pair currently trades last at 18.3937.
The previous day high was 18.7981 while the previous day low was 18.4222. The daily 38.2% Fib levels comes at 18.5658, expected to provide resistance. Similarly, the daily 61.8% fib level is at 18.6545, expected to provide resistance.
The USD/MXN tumbles to fresh two-week lows in the North American session at 18.3259, and sellers are taking a respite, exchanging hands slightly above the week’s lows. Investors shrugging off banking crisis woes shifted sentiment positively. Therefore, risk-perceived currencies in the FX space are printing gains. The USD/MXN trades at 18.3902.
Wall Street is opening the week with gains. A light economic docket in the United States (US) keeps traders focused on the developments around global banks. News emerged that First Citizens BancShares, Inc. agreeing to buy SVB Financial Group spurred an uptick in sentiment, which sent the USD/MXN sliding to its new weekly lows. Nevertheless, US Treasury bond yields are recovering, capping the USD/MXN drop.
US Treasury bond yields are rising, with the 10-year benchmark note rate at 3.473%, gaining almost ten basis points. However, the greenback has failed to follow suit with UST bond yields, with the US Dollar Index registering losses of 0.14%, at 102.973.
Meanwhile, money market futures expect the US Federal Reserve (Fed) to hold rates unchanged at the May meeting, as shown by the CME FedWatch Tool. Odds are at 63.8%, vs. 38.2% chances of a 25 bps rate hike.
During the weekend, Minnesota’s Fed President Neil Kashkari said that the risks for a recession have improved after the banking system crisis.
On the Mexican front, the Balance of Trade for February missed estimates of a $0.9B surplus and printed a deficit of $1.84B. However, the figures showed some improvement after January’s $4.125B deficit. Exports were reduced by 2.80% YoY in February, blamed on crude oil exports dropping 19.2%, while Imports grew at a 4.1% YoY pace.
USD/MXN remains neutral to downward biased, capped by the 20-day Exponential Moving Average (EMA) at around 18.5290, slightly above the psychological $18.50 figure. Oscillators remained at bearish areas, with the Relative Strength Index (RSI) below 50, while the Rate of Change (RoC) stayed below the neutral line. Therefore, further downside is warranted, but the market mood could spur a reversal.
Hence the USD/MXN first support would be the weekly low at 18.3259. A breach of the latter will expose the March 13 low at 18.2369, followed by the YTD low at 17.8967. On the other hand, if the USD/MXN reclaims $18.50, that could open the door for further gains. But as long as the USD/MXN stays below 18.7968, the pair will remain tilted downwards.
Technical Levels: Supports and Resistances
USDMXN currently trading at 18.3932 at the time of writing. Pair opened at 18.4492 and is trading with a change of -0.3 % .
| Overview | Overview.1 | |
|---|---|---|
| 0 | Today last price | 18.3932 |
| 1 | Today Daily Change | -0.0560 |
| 2 | Today Daily Change % | -0.3000 |
| 3 | Today daily open | 18.4492 |
The pair remains strongly bearish on the daily time frame. It trades below the 20 SMA @ 18.4472, 50 SMA 18.5993, 100 SMA @ 19.0168 and 200 SMA @ 19.5796.
| Trends | Trends.1 | |
|---|---|---|
| 0 | Daily SMA20 | 18.4472 |
| 1 | Daily SMA50 | 18.5993 |
| 2 | Daily SMA100 | 19.0168 |
| 3 | Daily SMA200 | 19.5796 |
The previous day high was 18.7981 while the previous day low was 18.4222. The daily 38.2% Fib levels comes at 18.5658, expected to provide resistance. Similarly, the daily 61.8% fib level is at 18.6545, expected to provide resistance.
Note the levels of interest below:
- Pivot support is noted at 18.3149, 18.1806, 17.9389
- Pivot resistance is noted at 18.6908, 18.9325, 19.0668
| Levels | Levels.1 |
|---|---|
| Previous Daily High | 18.7981 |
| Previous Daily Low | 18.4222 |
| Previous Weekly High | 19.2324 |
| Previous Weekly Low | 18.3797 |
| Previous Monthly High | 19.2901 |
| Previous Monthly Low | 18.2954 |
| Daily Fibonacci 38.2% | 18.5658 |
| Daily Fibonacci 61.8% | 18.6545 |
| Daily Pivot Point S1 | 18.3149 |
| Daily Pivot Point S2 | 18.1806 |
| Daily Pivot Point S3 | 17.9389 |
| Daily Pivot Point R1 | 18.6908 |
| Daily Pivot Point R2 | 18.9325 |
| Daily Pivot Point R3 | 19.0668 |
[/s2If]
Join Our Telegram Group


