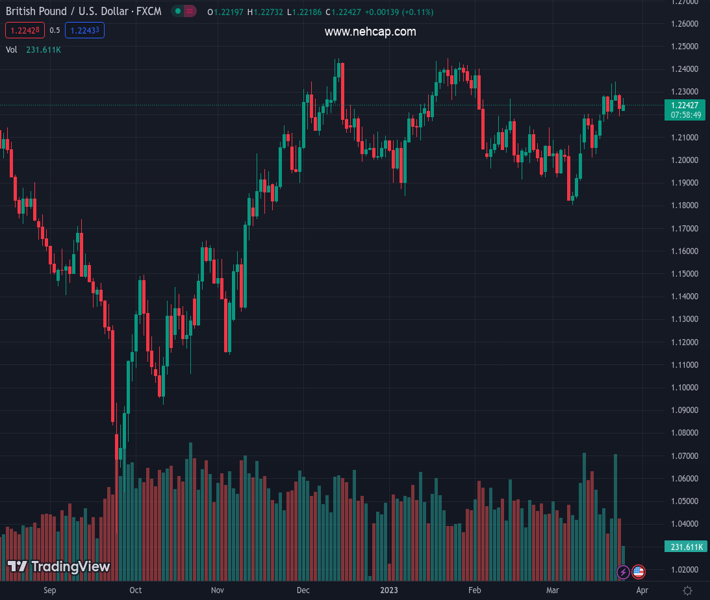
#GBPUSD @ 1.22417 catches fresh bids on Monday and reverses a major part of Friday’s downfall. (Pivot Orderbook analysis)
…
This is a premium post.
[s2If !current_user_can(access_s2member_level4)]Please register for PREMIUM VERSION HERE to read full post below containing analysis. In case of any error or you think you are not able to read the full post below, please email us at support#nehcap.com [lwa][/s2If] [s2If current_user_can(access_s2member_level4)]
- GBP/USD catches fresh bids on Monday and reverses a major part of Friday’s downfall.
- The risk-on mood undermines the safe-haven USD and remains supportive of the move.
- Rallying US bond yields acts as a tailwind for the buck and might cap any further gains.
The pair currently trades last at 1.22417.
The previous day high was 1.2292 while the previous day low was 1.2191. The daily 38.2% Fib levels comes at 1.223, expected to provide support. Similarly, the daily 61.8% fib level is at 1.2253, expected to provide resistance.
The GBP/USD pair regains positive traction on the first day of a new week and builds on its steady intraday ascent through the mid-European session. Spot prices climb to a fresh daily high, around the 1.2270-1.2275 area in the last hour, and reverse a major part of Friday’s losses amid the risk-on impulse.
Investors breathe a sigh of relief in reaction to the news that First Citizens Bank & Trust Company will buy all of Silicon Valley Bank’s deposits and loans from the Federal Deposit Insurance Corporation (FDIC). This is evident from a generally positive tone around the equity markets, which fails to assist the safe-haven US Dollar (USD) to capitalize on last week’s goodish rebound from its lowest level since February and lends support to the GBP/USD pair.
The Greenback is further undermined by the Federal Reserve’s hints of a possible pause to its rate-hiking cycle in the wake of the recent turmoil in the banking sector. That said, a strong follow-through rally in the US Treasury bond yields acts as a tailwind for the buck, which, in turn, might keep a lid on any meaningful upside for the GBP/USD pair. Hence, any subsequent move is more likely to confront stiff resistance near the 1.2300 round-figure mark.
Technical indicators on the daily chart, meanwhile, are holding in the positive zone and are still far from being in the overbought territory. This, in turn, suggests that some follow-through buying should pave the way for additional gains and a move towards retesting the monthly peak, around the 1.2340-1.2345 region. The positive momentum could get extended further and allow the GBP/USD pair to aim back to reclaim the 1.2400 round-figure mark.
On the flip side, the 1.2230 level now seems to protect the immediate downside ahead of the 1.2200 round figure and the 1.2175 support zone. A convincing break below might prompt some technical selling and drag the GBP/USD pair towards the 1.2100 mark. The latter coincides with the 100-day Simple Moving Average (SMA), below which spot prices could slide to the next relevant support near the 1.2055-1.2050 region en route to the 1.2000 psychological mark.
Technical Levels: Supports and Resistances
GBPUSD currently trading at 1.2268 at the time of writing. Pair opened at 1.2233 and is trading with a change of 0.29 % .
| Overview | Overview.1 | |
|---|---|---|
| 0 | Today last price | 1.2268 |
| 1 | Today Daily Change | 0.0035 |
| 2 | Today Daily Change % | 0.2900 |
| 3 | Today daily open | 1.2233 |
The pair remains strongly bullish on the daily timeframe. It trades above its 20 SMA @ 1.2085, 50 SMA 1.2148, 100 SMA @ 1.2093 and 200 SMA @ 1.1893.
| Trends | Trends.1 | |
|---|---|---|
| 0 | Daily SMA20 | 1.2085 |
| 1 | Daily SMA50 | 1.2148 |
| 2 | Daily SMA100 | 1.2093 |
| 3 | Daily SMA200 | 1.1893 |
The previous day high was 1.2292 while the previous day low was 1.2191. The daily 38.2% Fib levels comes at 1.223, expected to provide support. Similarly, the daily 61.8% fib level is at 1.2253, expected to provide resistance.
Note the levels of interest below:
- Pivot support is noted at 1.2185, 1.2137, 1.2083
- Pivot resistance is noted at 1.2287, 1.234, 1.2388
| Levels | Levels.1 |
|---|---|
| Previous Daily High | 1.2292 |
| Previous Daily Low | 1.2191 |
| Previous Weekly High | 1.2344 |
| Previous Weekly Low | 1.2167 |
| Previous Monthly High | 1.2402 |
| Previous Monthly Low | 1.1915 |
| Daily Fibonacci 38.2% | 1.2230 |
| Daily Fibonacci 61.8% | 1.2253 |
| Daily Pivot Point S1 | 1.2185 |
| Daily Pivot Point S2 | 1.2137 |
| Daily Pivot Point S3 | 1.2083 |
| Daily Pivot Point R1 | 1.2287 |
| Daily Pivot Point R2 | 1.2340 |
| Daily Pivot Point R3 | 1.2388 |
[/s2If]
Join Our Telegram Group


