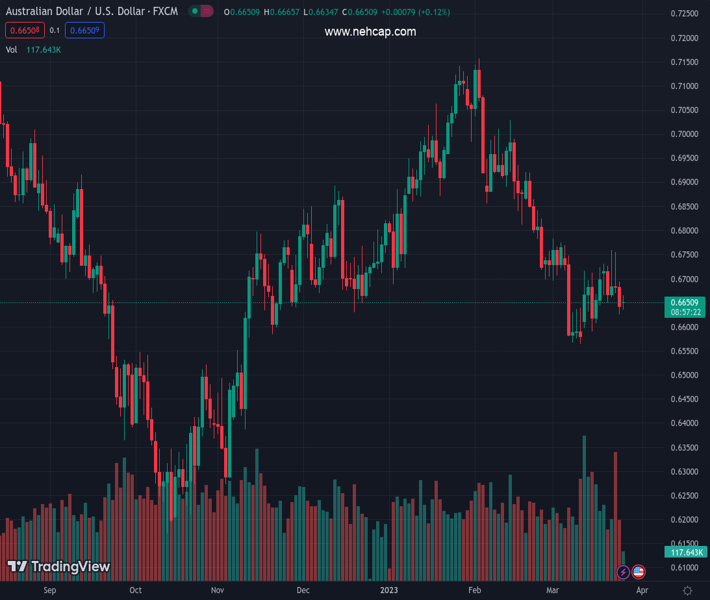
#AUDUSD @ 0.66494 struggles to gain any meaningful traction and oscillates in a range on Monday. (Pivot Orderbook analysis)
…
This is a premium post.
[s2If !current_user_can(access_s2member_level4)]Please register for PREMIUM VERSION HERE to read full post below containing analysis. In case of any error or you think you are not able to read the full post below, please email us at support#nehcap.com [lwa][/s2If] [s2If current_user_can(access_s2member_level4)]
- AUD/USD struggles to gain any meaningful traction and oscillates in a range on Monday.
- A positive risk tone lends support to the risk-sensitive Aussie amid subdued USD demand.
- Rallying US bond yields acts as a tailwind for the buck and caps the upside for the major.
The pair currently trades last at 0.66494.
The previous day high was 0.6694 while the previous day low was 0.6625. The daily 38.2% Fib levels comes at 0.6652, expected to provide resistance. Similarly, the daily 61.8% fib level is at 0.6668, expected to provide resistance.
The AUD/USD pair lacks any firm intraday direction on Monday and oscillates in a narrow trading band around mid-0.6600s through the mid-European session. Spot prices, meanwhile, remain well within the striking distance of over a one-week low touched on Friday and seem vulnerable to prolonging last week’s rejection slide from a technically significant 200-day Simple Moving Average (SMA).
A generally positive tone around the equity markets, bolstered by easing fears of a full-blown banking crisis, turns out to be a key factor offering some support to the risk-sensitive Aussie. News that First Citizens Bank & Trust Company will buy all of Silicon Valley Bank’s deposits and loans from the Federal Deposit Insurance Corporation (FDIC) calm market nerves about the contagion risk. Furthermore, reports that US authorities were in the early stage of deliberation about expanding emergency lending facilities boost investors’ confidence.
The risk-on flow, meanwhile, fails to assist the safe-haven US Dollar (USD) to capitalize on its recent strong recovery from a multi-week low touched last Thursday, which further contributes to limiting the downside for the AUD/USD pair. That said, a strong follow-through rally in the US Treasury bond yields acts as a tailwind for the Greenback. This, along with a dovish signal from the Reserve Bank of Australia (RBA) and the Fed, hinting at a pause in the rate-hiking cycle, warrants caution before placing aggressive directional bets around the major.
In the absence of any major market-moving economic releases from the US on Monday, the US bond yields might influence the USD price dynamics and provide some impetus to the AUD/USD pair. Apart from this, the broader risk sentiment could produce short-term trading opportunities, though the lack of any meaningful buying suggests that the path of least resistance for spot prices remains to the downside.
Technical Levels: Supports and Resistances
AUDUSD currently trading at 0.6649 at the time of writing. Pair opened at 0.6644 and is trading with a change of 0.08 % .
| Overview | Overview.1 | |
|---|---|---|
| 0 | Today last price | 0.6649 |
| 1 | Today Daily Change | 0.0005 |
| 2 | Today Daily Change % | 0.0800 |
| 3 | Today daily open | 0.6644 |
The pair remains strongly bearish on the daily time frame. It trades below the 20 SMA @ 0.6676, 50 SMA 0.6846, 100 SMA @ 0.6793 and 200 SMA @ 0.6758.
| Trends | Trends.1 | |
|---|---|---|
| 0 | Daily SMA20 | 0.6676 |
| 1 | Daily SMA50 | 0.6846 |
| 2 | Daily SMA100 | 0.6793 |
| 3 | Daily SMA200 | 0.6758 |
The previous day high was 0.6694 while the previous day low was 0.6625. The daily 38.2% Fib levels comes at 0.6652, expected to provide resistance. Similarly, the daily 61.8% fib level is at 0.6668, expected to provide resistance.
Note the levels of interest below:
- Pivot support is noted at 0.6615, 0.6585, 0.6546
- Pivot resistance is noted at 0.6684, 0.6724, 0.6753
| Levels | Levels.1 |
|---|---|
| Previous Daily High | 0.6694 |
| Previous Daily Low | 0.6625 |
| Previous Weekly High | 0.6759 |
| Previous Weekly Low | 0.6625 |
| Previous Monthly High | 0.7158 |
| Previous Monthly Low | 0.6698 |
| Daily Fibonacci 38.2% | 0.6652 |
| Daily Fibonacci 61.8% | 0.6668 |
| Daily Pivot Point S1 | 0.6615 |
| Daily Pivot Point S2 | 0.6585 |
| Daily Pivot Point S3 | 0.6546 |
| Daily Pivot Point R1 | 0.6684 |
| Daily Pivot Point R2 | 0.6724 |
| Daily Pivot Point R3 | 0.6753 |
[/s2If]
Join Our Telegram Group


