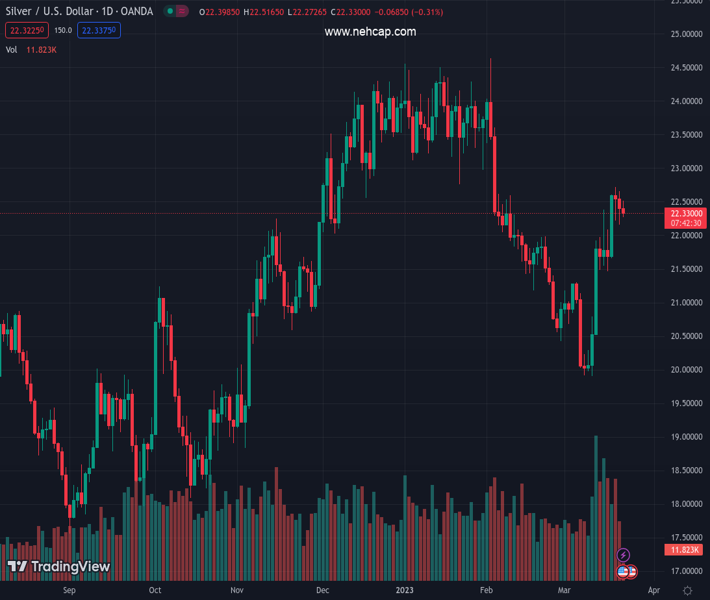
#XAGUSD @ 22.328 Silver remains on the defensive for the third successive day on Wednesday. (Pivot Orderbook analysis)
…
This is a premium post.
[s2If !current_user_can(access_s2member_level4)]Please register for PREMIUM VERSION HERE to read full post below containing analysis. In case of any error or you think you are not able to read the full post below, please email us at support#nehcap.com [lwa][/s2If] [s2If current_user_can(access_s2member_level4)]
- Silver remains on the defensive for the third successive day on Wednesday.
- The recent price action might still be categorized as a bullish consolidation.
- A convincing break below the $21.00 mark is needed to offset bullish bias.
The pair currently trades last at 22.328.
The previous day high was 22.65 while the previous day low was 22.16. The daily 38.2% Fib levels comes at 22.34, expected to provide resistance. Similarly, the daily 61.8% fib level is at 22.46, expected to provide resistance.
Silver attracts some intraday selling near the $22.50 area on Wednesday and remains on the defensive heading into the North American session. The white metal is currently placed around the $22.30 area, just above the weekly low touched the previous day, as traders keenly await the highly-anticipated FOMC policy decision for a fresh impetus.
Looking at the broader picture, the recent price action witnessed over the past three trading sessions constitutes the formation of a rectangle on hourly charts. Against the backdrop of the recent strong recovery from levels just below the $20.00 psychological mark, or the YTD low, this might still be categorized as a bullish consolidation phase before the next leg up. The constructive outlook is reinforced by the fact that oscillators on the daily chart are holding comfortably in the positive territory and are still far from being in the overbought zone.
Moreover, the recent breakout through the $21.65-$21.70 confluence favours bullish traders. Hence, any further slide towards the $22.00 mark could be seen as a buying opportunity and help limit the downside near the said resistance breakpoint, now turned support. This comprises the 200-period Simple Moving Average (SMA) on the 4-hour chart and the 38.2% Fibo. level, which should now act as a pivotal point.
That said, a convincing break below the latter could expose the $21.00 mark, representing the 23.6% Fibo. level. The XAG/USD might then turn vulnerable to accelerate the decline towards testing the $20.55-$20.50 intermediate support en route to the $20.00 psychological mark. The downward trajectory could get extended further towards the next relevant support near the $19.60 region.
On the flip side, immediate resistance is pegged near the $22.50 area ahead of the multi-week high, around the $20.70 zone set on Monday. This is closely followed by the $22.85 region (61.8% Fibo. level) and the $23.00 mark, which if cleared should pave the way for a move towards the $23.25-$23.35 hurdle. The XAG/USD might eventually aim to reclaim the $24.00 mark and climb further to the multi-month top, around the $24.65 zone touched in February.
Technical Levels: Supports and Resistances
XAGUSD currently trading at 22.28 at the time of writing. Pair opened at 22.4 and is trading with a change of -0.54 % .
| Overview | Overview.1 | |
|---|---|---|
| 0 | Today last price | 22.28 |
| 1 | Today Daily Change | -0.12 |
| 2 | Today Daily Change % | -0.54 |
| 3 | Today daily open | 22.40 |
The pair is trading above its 20 Daily moving average @ 21.23, below its 50 Daily moving average @ 22.29 , below its 100 Daily moving average @ 22.38 and above its 200 Daily moving average @ 20.96
| Trends | Trends.1 | |
|---|---|---|
| 0 | Daily SMA20 | 21.23 |
| 1 | Daily SMA50 | 22.29 |
| 2 | Daily SMA100 | 22.38 |
| 3 | Daily SMA200 | 20.96 |
The previous day high was 22.65 while the previous day low was 22.16. The daily 38.2% Fib levels comes at 22.34, expected to provide resistance. Similarly, the daily 61.8% fib level is at 22.46, expected to provide resistance.
Note the levels of interest below:
- Pivot support is noted at 22.15, 21.91, 21.66
- Pivot resistance is noted at 22.64, 22.89, 23.14
| Levels | Levels.1 |
|---|---|
| Previous Daily High | 22.65 |
| Previous Daily Low | 22.16 |
| Previous Weekly High | 22.61 |
| Previous Weekly Low | 20.54 |
| Previous Monthly High | 24.64 |
| Previous Monthly Low | 20.42 |
| Daily Fibonacci 38.2% | 22.34 |
| Daily Fibonacci 61.8% | 22.46 |
| Daily Pivot Point S1 | 22.15 |
| Daily Pivot Point S2 | 21.91 |
| Daily Pivot Point S3 | 21.66 |
| Daily Pivot Point R1 | 22.64 |
| Daily Pivot Point R2 | 22.89 |
| Daily Pivot Point R3 | 23.14 |
[/s2If]
Join Our Telegram Group


