#XAGUSD @ 22.353 Silver price prints three-day losing streak, confirms two-week-old bearish chart pattern., @nehcap view: Further downside expected (Pivot Orderbook analysis)
…
This is a premium post.
[s2If !current_user_can(access_s2member_level4)]Please register for PREMIUM VERSION HERE to read full post below containing analysis. In case of any error or you think you are not able to read the full post below, please email us at support#nehcap.com [lwa][/s2If] [s2If current_user_can(access_s2member_level4)]
- Silver price prints three-day losing streak, confirms two-week-old bearish chart pattern.
- Bearish MACD signals add strength to downside bias for XAG/USD price.
- 200-SMA, $21.30 can act as buffers during theoretical targeting surrounding $17.10.
- Silver buyers need validation from golden Fibonacci ratio.
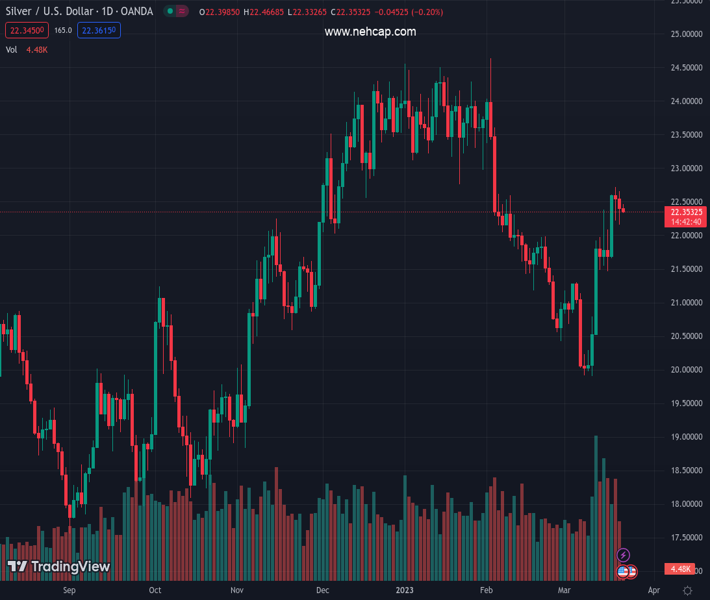
The pair currently trades last at 22.353.
The previous day high was 22.65 while the previous day low was 22.16. The daily 38.2% Fib levels comes at 22.34, expected to provide support. Similarly, the daily 61.8% fib level is at 22.46, expected to provide resistance.
Silver price (XAG/USD) remains depressed around $22.30, making rounds to intraday low during a three-day downtrend heading into Wednesday’s European session.
The bright metal’s latest fall could be linked to the confirmation of a two-week-old rising wedge bearish chart pattern, as well as the bearish MACD signals.
That said, the quote is well-set for visiting the 200-Simple Moving Average (SMA) support level surrounding $21.50 before declining towards the theoretical target of $17.10.
It’s worth noting that the late February swing high and the current monthly low, respectively around $22.00 and $19.90, can act as additional downside filters to watch during the XAG/USD’s further downside.
On the flip side, the stated wedge’s lower line acts as an immediate resistance for the Silver price of around $22.70.
Following that, the 61.8% Fibonacci retracement of the metal’s February-March downside, also known as the “golden Fibonacci ratio”, could challenge the Silver buyers near $22.85.
In a case where the XAG/USD remains firmer past $22.85, the aforementioned bearish chart pattern’s top line joins the late January swing low to highlight the $23.00 as a tough nut to crack for the Silver bulls before giving them control.
Trend: Further downside expected
Technical Levels: Supports and Resistances
XAGUSD currently trading at 22.35 at the time of writing. Pair opened at 22.4 and is trading with a change of -0.22% % .
| Overview | Overview.1 | |
|---|---|---|
| 0 | Today last price | 22.35 |
| 1 | Today Daily Change | -0.05 |
| 2 | Today Daily Change % | -0.22% |
| 3 | Today daily open | 22.4 |
The pair is trading above its 20 Daily moving average @ 21.23, above its 50 Daily moving average @ 22.29 , below its 100 Daily moving average @ 22.38 and above its 200 Daily moving average @ 20.96
| Trends | Trends.1 | |
|---|---|---|
| 0 | Daily SMA20 | 21.23 |
| 1 | Daily SMA50 | 22.29 |
| 2 | Daily SMA100 | 22.38 |
| 3 | Daily SMA200 | 20.96 |
The previous day high was 22.65 while the previous day low was 22.16. The daily 38.2% Fib levels comes at 22.34, expected to provide support. Similarly, the daily 61.8% fib level is at 22.46, expected to provide resistance.
Note the levels of interest below:
- Pivot support is noted at 22.15, 21.91, 21.66
- Pivot resistance is noted at 22.64, 22.89, 23.14
| Levels | Levels.1 |
|---|---|
| Previous Daily High | 22.65 |
| Previous Daily Low | 22.16 |
| Previous Weekly High | 22.61 |
| Previous Weekly Low | 20.54 |
| Previous Monthly High | 24.64 |
| Previous Monthly Low | 20.42 |
| Daily Fibonacci 38.2% | 22.34 |
| Daily Fibonacci 61.8% | 22.46 |
| Daily Pivot Point S1 | 22.15 |
| Daily Pivot Point S2 | 21.91 |
| Daily Pivot Point S3 | 21.66 |
| Daily Pivot Point R1 | 22.64 |
| Daily Pivot Point R2 | 22.89 |
| Daily Pivot Point R3 | 23.14 |
[/s2If]
Join Our Telegram Group


