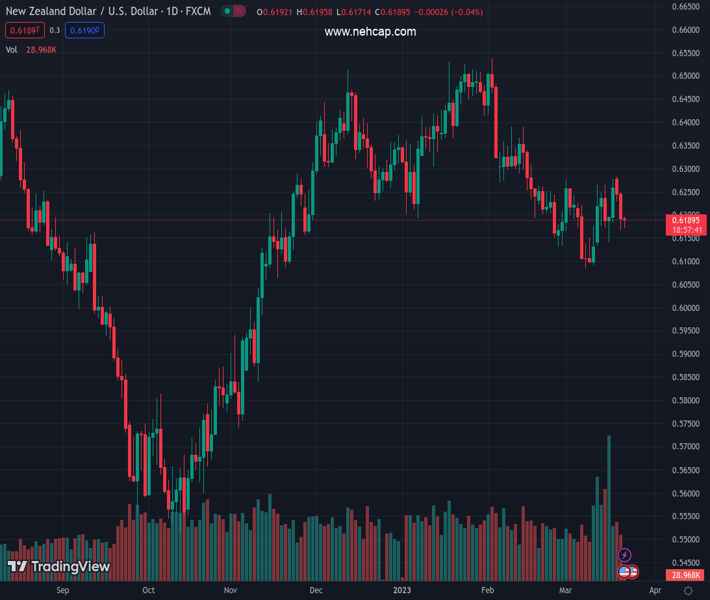
#NZDUSD @ 0.61880 has shown a recovery move from 0.6170 amid the risk-on market mood. (Pivot Orderbook analysis)
…
This is a premium post.
[s2If !current_user_can(access_s2member_level4)]Please register for PREMIUM VERSION HERE to read full post below containing analysis. In case of any error or you think you are not able to read the full post below, please email us at support#nehcap.com [lwa][/s2If] [s2If current_user_can(access_s2member_level4)]
- NZD/USD has shown a recovery move from 0.6170 amid the risk-on market mood.
- The kiwi asset is hovering near the upward-sloping trendline of the Ascending Triangle pattern.
- Investors should be aware of the fact that responsive buying can be kicked in as the Kiwi asset is at make-or-break levels.
The pair currently trades last at 0.61880.
The previous day high was 0.6258 while the previous day low was 0.6167. The daily 38.2% Fib levels comes at 0.6202, expected to provide resistance. Similarly, the daily 61.8% fib level is at 0.6223, expected to provide resistance.
The NZD/USD pair is demonstrating a solid recovery from 0.6170 in the Asian session. The kiwi asset remained weak on Tuesday as fears of poor growth in New Zealand refreshed.
Analysts at UOB cited “The impacts of severe weather and flooding earlier this year will cloud the economic outlook. Our view is that the economy is likely to experience further weakness ahead. We have lowered our GDP growth forecast for 2023 to 1.3%, from 1.5% previously.”
S&P500 futures are showing nominal gains in the Asian session. The 500-US stocks basket futures are expected to continue their two-day winning streak further as United States Treasury Secretary Janet Yellen confirmed that Federal Reserve’s (Fed) new Bank Term Funding facility and discount window lending is working to provide liquidity to the banking system.
The US Dollar Index (DXY) has continued its sideways performance around 103.20 as investors are awaiting the interest rate decision by the Fed for fresh impetus.
On a two-hour scale, NZD/USD is hovering near the upward-sloping trendline of the Ascending Triangle chart pattern, which is plotted from March 09 low at 0.6105. While the horizontal resistance of the chart pattern is placed from March 01 high around 0.6277.
A bear cross, represented by the 20-and 50-period Exponential Moving Averages (EMAs) at 0.6220, indicates more weakness ahead.
Investors should be aware of the fact that responsive buying can be kicked in as the Kiwi asset is at make or break level.
The Relative Strength Index (RSI) (14) has slipped below 40.00, showing no signs of divergence, and oversold yet.
A buying opportunity in the Kiwi asset will emerge it will surpass March 1 high at 0.6276, which will drive the pair toward the round-level resistance at 0.6300 followed by February 14 high at 0.6389.
In an alternate scenario, a breakdown of March 21 low at 0.6167 will drag the asset toward March 15 low at 0.6139. A slippage below the latter will expose the asset for more downside toward the round-level support at 0.6100.
Technical Levels: Supports and Resistances
NZDUSD currently trading at 0.6189 at the time of writing. Pair opened at 0.6194 and is trading with a change of -0.08 % .
| Overview | Overview.1 | |
|---|---|---|
| 0 | Today last price | 0.6189 |
| 1 | Today Daily Change | -0.0005 |
| 2 | Today Daily Change % | -0.0800 |
| 3 | Today daily open | 0.6194 |
The pair is trading below its 20 Daily moving average @ 0.6193, below its 50 Daily moving average @ 0.6306 , below its 100 Daily moving average @ 0.6271 and above its 200 Daily moving average @ 0.6162
| Trends | Trends.1 | |
|---|---|---|
| 0 | Daily SMA20 | 0.6193 |
| 1 | Daily SMA50 | 0.6306 |
| 2 | Daily SMA100 | 0.6271 |
| 3 | Daily SMA200 | 0.6162 |
The previous day high was 0.6258 while the previous day low was 0.6167. The daily 38.2% Fib levels comes at 0.6202, expected to provide resistance. Similarly, the daily 61.8% fib level is at 0.6223, expected to provide resistance.
Note the levels of interest below:
- Pivot support is noted at 0.6155, 0.6115, 0.6064
- Pivot resistance is noted at 0.6246, 0.6297, 0.6337
| Levels | Levels.1 |
|---|---|
| Previous Daily High | 0.6258 |
| Previous Daily Low | 0.6167 |
| Previous Weekly High | 0.6278 |
| Previous Weekly Low | 0.6131 |
| Previous Monthly High | 0.6538 |
| Previous Monthly Low | 0.6131 |
| Daily Fibonacci 38.2% | 0.6202 |
| Daily Fibonacci 61.8% | 0.6223 |
| Daily Pivot Point S1 | 0.6155 |
| Daily Pivot Point S2 | 0.6115 |
| Daily Pivot Point S3 | 0.6064 |
| Daily Pivot Point R1 | 0.6246 |
| Daily Pivot Point R2 | 0.6297 |
| Daily Pivot Point R3 | 0.6337 |
[/s2If]
Join Our Telegram Group


