#EURCHF @ 0.99314 keeps the previous day’s pullback from 13-day high, stays pressured of late., @nehcap view: Further downside expected (Pivot Orderbook analysis)
…
This is a premium post.
[s2If !current_user_can(access_s2member_level4)]Please register for PREMIUM VERSION HERE to read full post below containing analysis. In case of any error or you think you are not able to read the full post below, please email us at support#nehcap.com [lwa][/s2If] [s2If current_user_can(access_s2member_level4)]
- EUR/CHF keeps the previous day’s pullback from 13-day high, stays pressured of late.
- Failure to stay beyond key EMA joins unimpressive oscillators to favor bears.
- 100-EMA appears immediate support; 4.5-month-old horizontal suppot is the key barrier for sellers.
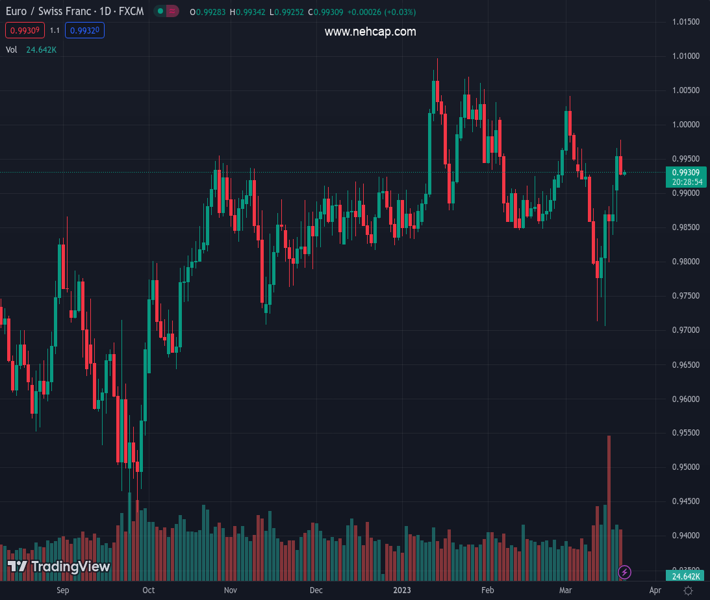
The pair currently trades last at 0.99314.
The previous day high was 0.9978 while the previous day low was 0.9926. The daily 38.2% Fib levels comes at 0.9946, expected to provide resistance. Similarly, the daily 61.8% fib level is at 0.9958, expected to provide resistance.
EUR/CHF holds lower ground near 0.9930 during a sluggish Asian session on early Wednesday, following a pullback from the two-week high the previous day.
The exotic pair rose to the highest levels in more than two weeks the previous day before reversing from 0.9978 as it failed to extend the 200-day Exponential Moving Average (EMA). The reason could be linked to the unimpressive RSI and MACD signals.
With the failure to stay beyond the 200-EMA and lackluster oscillators, namely the RSI (14) and MACD, EUR/CHF is likely to decline further, which in turn highlights the 100-EMA support of 0.9900 as the immediate attraction for the pair sellers.
Following that, the 38.2% and 50% Fibonacci retracement level of the pair’s up-move from September 2022 to January 2023, respectively near 0.9835 and 0.9755, will be in focus.
It’s worth noting, however, that a broad support zone comprising multiple lows marked since the mid-November 2022, between 0.9705 and 0.9720, appears a tough nut to crack for the EUR/CHF bears to break.
On the flip side, a successful break of the 200-EMA becomes necessary for the EUR/CHF bulls to keep the reins.
Even so, the 1.0000 psychological magnet and a downward-sloping resistance line from late January, close to 1.0022 by the press time, becomes crucial to challenge the upside moves.
Trend: Further downside expected
Technical Levels: Supports and Resistances
EURCHF currently trading at 0.993 at the time of writing. Pair opened at 0.9932 and is trading with a change of -0.02% % .
| Overview | Overview.1 | |
|---|---|---|
| 0 | Today last price | 0.993 |
| 1 | Today Daily Change | -0.0002 |
| 2 | Today Daily Change % | -0.02% |
| 3 | Today daily open | 0.9932 |
The pair is trading above its 20 Daily moving average @ 0.9907, below its 50 Daily moving average @ 0.9934 , above its 100 Daily moving average @ 0.9896 and above its 200 Daily moving average @ 0.9846
| Trends | Trends.1 | |
|---|---|---|
| 0 | Daily SMA20 | 0.9907 |
| 1 | Daily SMA50 | 0.9934 |
| 2 | Daily SMA100 | 0.9896 |
| 3 | Daily SMA200 | 0.9846 |
The previous day high was 0.9978 while the previous day low was 0.9926. The daily 38.2% Fib levels comes at 0.9946, expected to provide resistance. Similarly, the daily 61.8% fib level is at 0.9958, expected to provide resistance.
Note the levels of interest below:
- Pivot support is noted at 0.9913, 0.9894, 0.9861
- Pivot resistance is noted at 0.9965, 0.9997, 1.0016
| Levels | Levels.1 |
|---|---|
| Previous Daily High | 0.9978 |
| Previous Daily Low | 0.9926 |
| Previous Weekly High | 0.9913 |
| Previous Weekly Low | 0.9706 |
| Previous Monthly High | 1.0033 |
| Previous Monthly Low | 0.9847 |
| Daily Fibonacci 38.2% | 0.9946 |
| Daily Fibonacci 61.8% | 0.9958 |
| Daily Pivot Point S1 | 0.9913 |
| Daily Pivot Point S2 | 0.9894 |
| Daily Pivot Point S3 | 0.9861 |
| Daily Pivot Point R1 | 0.9965 |
| Daily Pivot Point R2 | 0.9997 |
| Daily Pivot Point R3 | 1.0016 |
[/s2If]
Join Our Telegram Group


