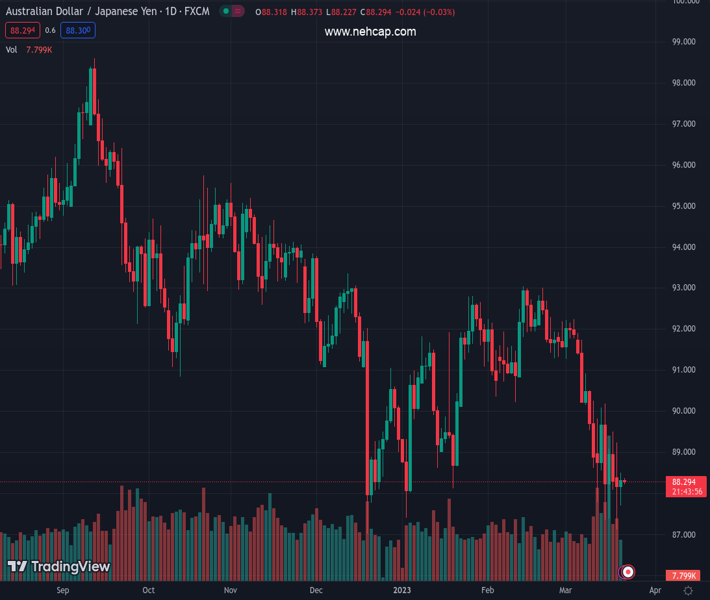
#AUDJPY @ 88.2890 formed a bullish harami candle pattern, suggesting the pair is upward biased. (Pivot Orderbook analysis)
…
This is a premium post.
[s2If !current_user_can(access_s2member_level4)]Please register for PREMIUM VERSION HERE to read full post below containing analysis. In case of any error or you think you are not able to read the full post below, please email us at support#nehcap.com [lwa][/s2If] [s2If current_user_can(access_s2member_level4)]
- AUD/JPY formed a bullish harami candle pattern, suggesting the pair is upward biased.
- However, oscillators are still pointing south, so caution is warranted.
- AUD/JPY Price Analysis: Once it clears 89.00, that would pave the way toward 90.00.
The pair currently trades last at 88.2890.
The previous day high was 89.24 while the previous day low was 87.14. The daily 38.2% Fib levels comes at 87.94, expected to provide support. Similarly, the daily 61.8% fib level is at 88.44, expected to provide resistance.
The AUD/JPY trimmed some of its Monday losses on Tuesday and gained 0.16%. The pair formed a bullish harami two-candle pattern that could open the door for further gains, but firstly it needs to the region the 89.00 figure. At the time of writing, the AUD/JPY is trading at 88.32, up 0.01% as the Asian session begins.
On Monday, the AUD/JPY printed a new YTD low at 87.12, then rallied above the 88.00 mark and registered a huge spinning top candlestick. On Tuesday, price action shrank, as usual, ahead of the US Federal Reserve’s (Fed) monetary policy meeting and formed a hammer. Additionally, price action was well contained within the previous day and formed a bullish harami. That said, the AUD/JPY is headed upward, although oscillators, such as the Relative Strength Index (RSI), stay in bearish territory.
Therefore, the AUD/JPY first resistance would be the March 21 high at 88.50, followed by the 89.00 mark. Once broken, the AUD/JPY would challenge the March 20 high at 89.23. A breach of the latter will expose the 20-day Exponential Moving Average (EMA) at 89.67. ahead of reaching 90.00.
In an alternate scenario, an AUD/JPY bearish continuation could happen if the pair dives below the March 21 lows of 87.71, putting into play a fall toward new YTD lows at 87.12.
Technical Levels: Supports and Resistances
AUDJPY currently trading at 88.31 at the time of writing. Pair opened at 88.24 and is trading with a change of 0.08 % .
| Overview | Overview.1 | |
|---|---|---|
| 0 | Today last price | 88.31 |
| 1 | Today Daily Change | 0.07 |
| 2 | Today Daily Change % | 0.08 |
| 3 | Today daily open | 88.24 |
The pair remains strongly bearish on the daily time frame. It trades below the 20 SMA @ 90.52, 50 SMA 90.98, 100 SMA @ 91.55 and 200 SMA @ 92.88.
| Trends | Trends.1 | |
|---|---|---|
| 0 | Daily SMA20 | 90.52 |
| 1 | Daily SMA50 | 90.98 |
| 2 | Daily SMA100 | 91.55 |
| 3 | Daily SMA200 | 92.88 |
The previous day high was 89.24 while the previous day low was 87.14. The daily 38.2% Fib levels comes at 87.94, expected to provide support. Similarly, the daily 61.8% fib level is at 88.44, expected to provide resistance.
Note the levels of interest below:
- Pivot support is noted at 87.17, 86.1, 85.07
- Pivot resistance is noted at 89.27, 90.31, 91.38
| Levels | Levels.1 |
|---|---|
| Previous Daily High | 89.24 |
| Previous Daily Low | 87.14 |
| Previous Weekly High | 90.20 |
| Previous Weekly Low | 87.36 |
| Previous Monthly High | 93.06 |
| Previous Monthly Low | 90.24 |
| Daily Fibonacci 38.2% | 87.94 |
| Daily Fibonacci 61.8% | 88.44 |
| Daily Pivot Point S1 | 87.17 |
| Daily Pivot Point S2 | 86.10 |
| Daily Pivot Point S3 | 85.07 |
| Daily Pivot Point R1 | 89.27 |
| Daily Pivot Point R2 | 90.31 |
| Daily Pivot Point R3 | 91.38 |
[/s2If]
Join Our Telegram Group


