Crude is higher as investors regained some confidence in the economic outlook (Pivot Orderbook analysis)
…
This is a premium post.
[s2If !current_user_can(access_s2member_level4)]Please register for PREMIUM VERSION HERE to read full post below containing analysis. In case of any error or you think you are not able to read the full post below, please email us at support#nehcap.com [lwa][/s2If] [s2If current_user_can(access_s2member_level4)]
- Crude is higher as investors regained some confidence in the economic outlook
- WTI traders turn to the Fed for the next catalyst.
The pair currently trades last at 69.56.
The previous day high was 67.9 while the previous day low was 64.39. The daily 38.2% Fib levels comes at 66.56, expected to provide support. Similarly, the daily 61.8% fib level is at 65.73, expected to provide support.
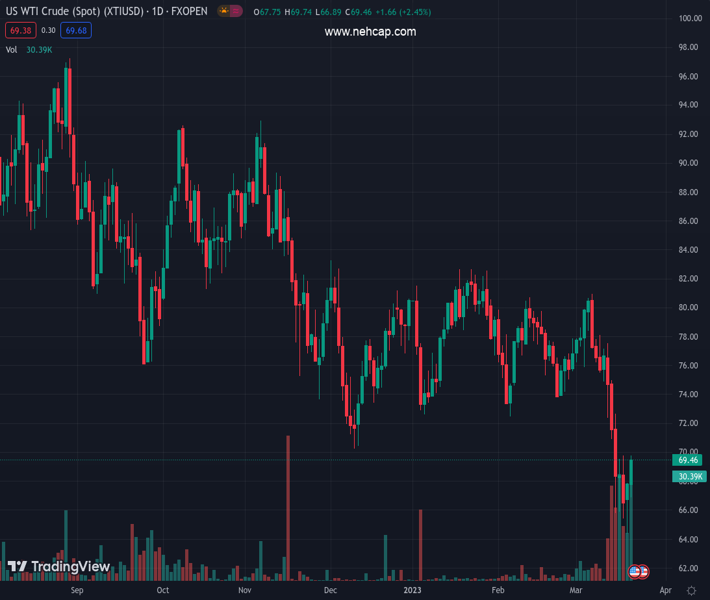
West Texas Intermediate WTI crude is trading up by some 2.4% towards the close on Wall Street and rallied from a low of $66.96 to a high of $69.72 as investors regained some confidence in the economic outlook following the weekend rescue of Credit Suisse.
Meanwhile, the Federal Reserve will announce the interest rate decision on Wednesday after it began its two-day meeting on Tuesday whereby markets are pricing in the likelihood that it will end with a quarter-point hike to interest rates. Swiss authorities helped to calm market fears of an extended banking crisis and crude prices are now 3.9% higher since the week began after dropping by 13% last week. The black gold has also rallied as investors rushed back into risk assets following more assurances from regulators on support for the US banking sector. T
´´The potential expansion of FDIC’s coverage to all deposits soothed concerns of further bank runs. The support was aided by further supply-side issues. Russian extended its 500kb/d crude output cut through June,´´ analysts at TANZ Bank explained.
´´This was based on current market conditions, according to Deputy Prime Minister Alexander Novak. This is despite tanker tracking data showing little sign of reduction in trade. Broader sentiment remains bullish, with top traders saying oil’s fundamentals are getting stronger. There are concerns that supply may also get hit more than demand amid the banking crisis. US shale output is most at risk from tighter credit conditions from regional US banks.´´
Meanwhile, we have the pair of weekly US oil inventory reports starting with trade group API today followed by the official EIA inventory data on Wednesday. The API has shown a large headline build vs. the draw expected.
Apart from that, traders are unlikely to position too heavily one way or another before the Federal Reserve makes its highly anticipated announcement on interest rates tomorrow. The central bank is still expected to continue to try and slow the US economy to lower inflation, despite the banking crisis and the fears it could spur a demand-destroying recession.
The Fed is expected to hike and take the Fed Funds rate to 4.75%-5.00%. There will also be the dot plot and the post-meeting communication is likely to emphasize that the Fed is not done yet in terms of tightening.
Analysts at TD Securities argued that the officials will likely be flagging the more uncertain economic environment.
´´Treasuries will react to the Fed’s messaging around future hikes and the dot plot. Any hint that the Fed will stop hikes due to stability worries could create an outsized market reaction,´´ the analysts said. ´´Messaging and dot-plot will be critical. Our base case is hawkish which poses a risk that STIR vol persists, (The short-term interest rate (STIR) analytics)´´
Technical Levels: Supports and Resistances
XTIUSD currently trading at 69.56 at the time of writing. Pair opened at 67.82 and is trading with a change of 2.57 % .
| Overview | Overview.1 | |
|---|---|---|
| 0 | Today last price | 69.56 |
| 1 | Today Daily Change | 1.74 |
| 2 | Today Daily Change % | 2.57 |
| 3 | Today daily open | 67.82 |
The pair remains strongly bearish on the daily time frame. It trades below the 20 SMA @ 74.77, 50 SMA 77.1, 100 SMA @ 78.41 and 200 SMA @ 85.33.
| Trends | Trends.1 | |
|---|---|---|
| 0 | Daily SMA20 | 74.77 |
| 1 | Daily SMA50 | 77.10 |
| 2 | Daily SMA100 | 78.41 |
| 3 | Daily SMA200 | 85.33 |
The previous day high was 67.9 while the previous day low was 64.39. The daily 38.2% Fib levels comes at 66.56, expected to provide support. Similarly, the daily 61.8% fib level is at 65.73, expected to provide support.
Note the levels of interest below:
- Pivot support is noted at 65.5, 63.19, 61.99
- Pivot resistance is noted at 69.02, 70.21, 72.53
| Levels | Levels.1 |
|---|---|
| Previous Daily High | 67.90 |
| Previous Daily Low | 64.39 |
| Previous Weekly High | 77.55 |
| Previous Weekly Low | 65.44 |
| Previous Monthly High | 80.75 |
| Previous Monthly Low | 72.50 |
| Daily Fibonacci 38.2% | 66.56 |
| Daily Fibonacci 61.8% | 65.73 |
| Daily Pivot Point S1 | 65.50 |
| Daily Pivot Point S2 | 63.19 |
| Daily Pivot Point S3 | 61.99 |
| Daily Pivot Point R1 | 69.02 |
| Daily Pivot Point R2 | 70.21 |
| Daily Pivot Point R3 | 72.53 |
[/s2If]
Join Our Telegram Group
")


