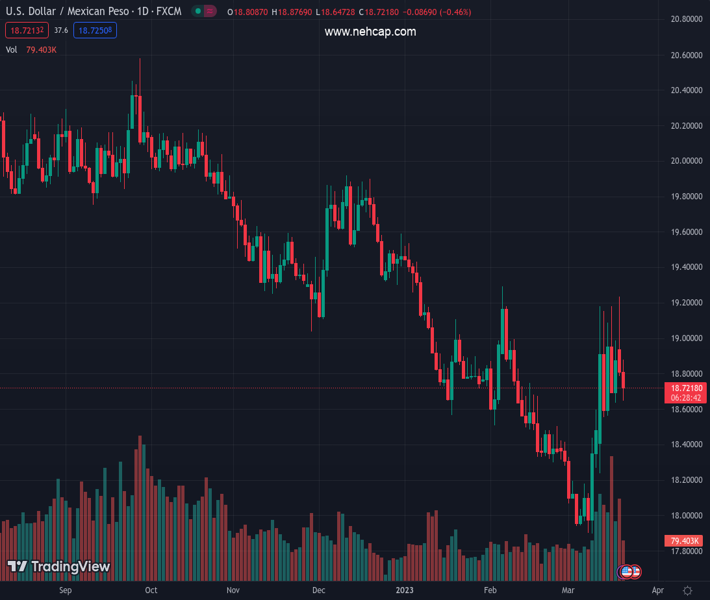
#USDMXN @ 18.7352 The Mexican Peso appreciates against the US Dollar ahead of the FOMC’s meeting. (Pivot Orderbook analysis)
…
This is a premium post.
[s2If !current_user_can(access_s2member_level4)]Please register for PREMIUM VERSION HERE to read full post below containing analysis. In case of any error or you think you are not able to read the full post below, please email us at support#nehcap.com [lwa][/s2If] [s2If current_user_can(access_s2member_level4)]
- The Mexican Peso appreciates against the US Dollar ahead of the FOMC’s meeting.
- An upbeat sentiment in the financial markets was one of the main reasons the USD/MXN fell.
- The US Treasury bond yield recovery began to reflect a 25 bps rate hike by the Fed.
- USD/MXN Price Analysis: Could resume downwards if it conquers 18.60; otherwise, upside risks remain.
The pair currently trades last at 18.7352.
The previous day high was 19.2324 while the previous day low was 18.7879. The daily 38.2% Fib levels comes at 18.9577, expected to provide resistance. Similarly, the daily 61.8% fib level is at 19.0626, expected to provide resistance.
The Mexican Peso (MXN) strengthens against the US Dollar (USD) courtesy of an upbeat sentiment amongst investors after Wall Street’s three major indices opened with gains. Therefore, the USD/MXN pair extended its losses below Monday’s low of 18.7857, though the 50-day EMA at 18.6820 capped the US Dollar losses. At the time of writing, the USD/MXN is trading at 18.7673, down 0.24%.
Sentiment remains upbeat. The financial markets narrative changed from inflation to a banking and credit crisis after the failure of two banks in the United States and another at the brisk of default. That has shifted global central banks’ interest rate increases expectations, with traders foreseeing that the Fed could cut rates in the year.
Money market futures expect the Fed to hike 25 bps, with odds at 83.4%, compared to Monday’s 73.8%. Nevertheless, uncertainty around how Fed Chair Jerome Powell’s press conference will go could rock the boat in the financial markets.
Delving a little deep into Jerome Powell’s press conference, Societe Generale analysts said, “the language around inflation and guidance on interest rates will take precedence over the next 48 hours. The Fed must err on the side of caution, and this means toning down the hawkish narrative until confidence in bank liquidity has been restored. SG economists forecast a +25bp hike, while the market is pricing in nearly 26% probability of a pause.”
Given the backdrop, the USD/MXN might consolidate around current exchange rates. The lack of economic data from Mexico would keep traders leaning into the dynamics of the US Dollar.
The US Dollar Index continues to edge lower, down 0.17%, at 103.132. US Treasury bond yields responded to expectations for a rate hike, with 2s and 10s up 16 and 9 bps each, at 4.148% and 3.579%, respectively.
Of late, Existing Home Sales in the United States in February rose 14.5% MoM, above estimates of 5%, the biggest increase since July 2020, and finished one full year of declines in sales.
After failing to hold to gains above 19.0000, the USD/MXN resumed its downtrend, clearing the 100-day Exponential Moving Average (EMA) support at 18.9846. However, it should be said that the USD/MXN moved from trading within the low 18.00s to 18.10s towards the 18.60-18.90s area. Oscillators like the Relative Strength Index (RSI) and the Rate of Change (RoC) are still bullish, but RSI’s slope shifted downwards, suggesting that buying pressure is waning.
If the USD/MXN resumes upwards, the first resistance would be the 100-day EMA at 18.9848, followed by the $19.00. A breach of the latter will expose the weekly high at 19.2327. for a bearish resumption, the USD/MXN needs to crack $18.60, so sellers could have a chance to test the 20-day EMA at 18.5635 before diving toward $18.00.
Technical Levels: Supports and Resistances
USDMXN currently trading at 18.7468 at the time of writing. Pair opened at 18.8231 and is trading with a change of -0.41 % .
| Overview | Overview.1 | |
|---|---|---|
| 0 | Today last price | 18.7468 |
| 1 | Today Daily Change | -0.0763 |
| 2 | Today Daily Change % | -0.4100 |
| 3 | Today daily open | 18.8231 |
The pair is trading above its 20 Daily moving average @ 18.4166, above its 50 Daily moving average @ 18.6273 , below its 100 Daily moving average @ 19.0605 and below its 200 Daily moving average @ 19.6164
| Trends | Trends.1 | |
|---|---|---|
| 0 | Daily SMA20 | 18.4166 |
| 1 | Daily SMA50 | 18.6273 |
| 2 | Daily SMA100 | 19.0605 |
| 3 | Daily SMA200 | 19.6164 |
The previous day high was 19.2324 while the previous day low was 18.7879. The daily 38.2% Fib levels comes at 18.9577, expected to provide resistance. Similarly, the daily 61.8% fib level is at 19.0626, expected to provide resistance.
Note the levels of interest below:
- Pivot support is noted at 18.6632, 18.5033, 18.2187
- Pivot resistance is noted at 19.1077, 19.3923, 19.5522
| Levels | Levels.1 |
|---|---|
| Previous Daily High | 19.2324 |
| Previous Daily Low | 18.7879 |
| Previous Weekly High | 19.1812 |
| Previous Weekly Low | 18.2397 |
| Previous Monthly High | 19.2901 |
| Previous Monthly Low | 18.2954 |
| Daily Fibonacci 38.2% | 18.9577 |
| Daily Fibonacci 61.8% | 19.0626 |
| Daily Pivot Point S1 | 18.6632 |
| Daily Pivot Point S2 | 18.5033 |
| Daily Pivot Point S3 | 18.2187 |
| Daily Pivot Point R1 | 19.1077 |
| Daily Pivot Point R2 | 19.3923 |
| Daily Pivot Point R3 | 19.5522 |
[/s2If]
Join Our Telegram Group
")


