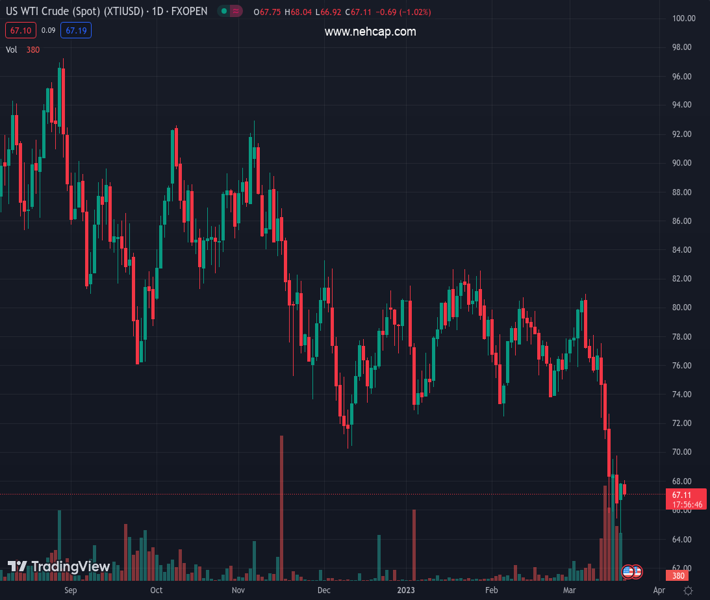
WTI takes offers to refresh intraday low, reverses the previous day’s bounce off the lowest levels since December 2021. (Pivot Orderbook analysis)
…
This is a premium post.
[s2If !current_user_can(access_s2member_level4)]Please register for PREMIUM VERSION HERE to read full post below containing analysis. In case of any error or you think you are not able to read the full post below, please email us at support#nehcap.com [lwa][/s2If] [s2If current_user_can(access_s2member_level4)]
- WTI takes offers to refresh intraday low, reverses the previous day’s bounce off the lowest levels since December 2021.
- US Dollar Index licks its wounds near five-week low, traces rebound in yields.
- Market players remain cautious amid banking sector fallout, hawkish Fed bets.
- Receding optimism surrounding China, cautious mood ahead of API inventories favor Oil bears.
The pair currently trades last at 67.37.
The previous day high was 67.9 while the previous day low was 64.39. The daily 38.2% Fib levels comes at 66.56, expected to provide support. Similarly, the daily 61.8% fib level is at 65.73, expected to provide support.
WTI crude oil renews its intraday low near $67.30 while reversing the previous day’s corrective bounce off a 27-month low during early Tuesday. In doing so, the black gold takes clues from the US Dollar’s rebound, as well as a corrective bounce in the US Treasury bond yields.
That said, the US Dollar Index (DXY) prints the first daily gains around 103.35 as the greenback bears lick their wounds after a three-day losing streak. That said, Treasury bond yields remain inactive as Japan’s holidays limited bond trading in Asia. It’s worth noting that the US 10-year and two-year Treasury bond yields bounced off the lowest levels since September 2022 the previous day.
It should be noted that the market’s failure to cheer the risk-on mood contrasts with the headlines suggesting an ongoing discussion about deposit guarantees in the US banks and challenging the WTI crude oil traders.
Also important to note is the lack of risk-positive statements from China, as well as hopes of more Oil output, due to US President Biden’s readiness for releasing the Strategic Petroleum Reserve (SPR) on need. It’s worth noting that Saudi Arabia’s support to the OPEC+ supply-cut accord and hopes for more energy demand in the years to come, as per the latest energy demand forecasts from the Organization of the Petroleum Exporting Countries and Russia, known as OPEC+, as well as the US Energy Information Administration.
Above all, recently promising hawkish Fed bets and fears of a banking crisis weigh on the WTI crude Oil prices ahead of the weekly release of industry inventories, from the American Petroleum Institute (API).
Although the oversold RSI triggered WTI crude oil’s recovery from a multi-month low, the recovery remains elusive unless crossing the December 2022 low of nearly $70.30.
Technical Levels: Supports and Resistances
XTIUSD currently trading at 67.37 at the time of writing. Pair opened at 67.82 and is trading with a change of -0.66% % .
| Overview | Overview.1 | |
|---|---|---|
| 0 | Today last price | 67.37 |
| 1 | Today Daily Change | -0.45 |
| 2 | Today Daily Change % | -0.66% |
| 3 | Today daily open | 67.82 |
The pair remains strongly bearish on the daily time frame. It trades below the 20 SMA @ 74.77, 50 SMA 77.1, 100 SMA @ 78.41 and 200 SMA @ 85.33.
| Trends | Trends.1 | |
|---|---|---|
| 0 | Daily SMA20 | 74.77 |
| 1 | Daily SMA50 | 77.10 |
| 2 | Daily SMA100 | 78.41 |
| 3 | Daily SMA200 | 85.33 |
The previous day high was 67.9 while the previous day low was 64.39. The daily 38.2% Fib levels comes at 66.56, expected to provide support. Similarly, the daily 61.8% fib level is at 65.73, expected to provide support.
Note the levels of interest below:
- Pivot support is noted at 65.5, 63.19, 61.99
- Pivot resistance is noted at 69.02, 70.21, 72.53
| Levels | Levels.1 |
|---|---|
| Previous Daily High | 67.90 |
| Previous Daily Low | 64.39 |
| Previous Weekly High | 77.55 |
| Previous Weekly Low | 65.44 |
| Previous Monthly High | 80.75 |
| Previous Monthly Low | 72.50 |
| Daily Fibonacci 38.2% | 66.56 |
| Daily Fibonacci 61.8% | 65.73 |
| Daily Pivot Point S1 | 65.50 |
| Daily Pivot Point S2 | 63.19 |
| Daily Pivot Point S3 | 61.99 |
| Daily Pivot Point R1 | 69.02 |
| Daily Pivot Point R2 | 70.21 |
| Daily Pivot Point R3 | 72.53 |
[/s2If]
Join Our Telegram Group
")


