#USDCAD @ 1.36812 rebound from one-week low, mildly bid of late., @nehcap view: Limited recovery expected (Pivot Orderbook analysis)
…
This is a premium post.
[s2If !current_user_can(access_s2member_level4)]Please register for PREMIUM VERSION HERE to read full post below containing analysis. In case of any error or you think you are not able to read the full post below, please email us at support#nehcap.com [lwa][/s2If] [s2If current_user_can(access_s2member_level4)]
- USD/CAD rebound from one-week low, mildly bid of late.
- Convergence of three-month-old support line, 21-DMA puts floor under Loonie prices.
- Bearish MACD signals, descending resistance line from March 10 prod bulls.
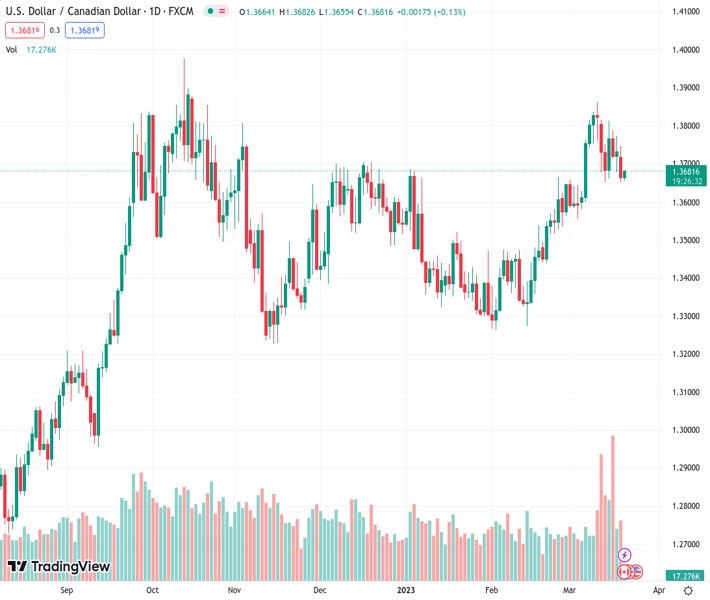
The pair currently trades last at 1.36812.
The previous day high was 1.3747 while the previous day low was 1.3652. The daily 38.2% Fib levels comes at 1.3688, expected to provide resistance. Similarly, the daily 61.8% fib level is at 1.3711, expected to provide resistance.
USD/CAD renews its intraday high around 1.3680 as it pares the biggest daily loss in more than a week while bouncing off a multi-day-old support line, as well as from the 21-DMA, during early Tuesday.
It should, however, be noted that the recovery moves fail to gain support from the MACD, as the oscillator keeps flashing bearish signals. Also testing the Loonie pair buyers is a seven-day-old descending resistance line near 1.3745.
Even if the quote rises past the 1.3745 hurdle, multiple resistances between 1.3750-60 can challenge the USD/CAD buyers before directing them to the monthly high surrounding 1.3865, a break of which opens the door for the pair’s run-up towards the previous yearly top of 1.3977.
On the contrary, the 21-DMA and a three-month-old support line, respectively near 1.3670 and 1.3660, restrict short-term USD/CAD downside.
In a case where the Loonie pair provides a daily closing below 1.3660, a slump toward the monthly low of 1.3555 can’t be ruled out. Though, the 1.3600 round figure may act as an intermediate halt during the anticipated fall.
Should the USD/CAD bears keep the reins past 1.3555, the late January swing high around 1.3520 appears the last defense of the pair buyers.
Overall, USD/CAD remains bearish despite the latest recovery moves.
Trend: Limited recovery expected
Technical Levels: Supports and Resistances
USDCAD currently trading at 1.368 at the time of writing. Pair opened at 1.3664 and is trading with a change of 0.12% % .
| Overview | Overview.1 | |
|---|---|---|
| 0 | Today last price | 1.368 |
| 1 | Today Daily Change | 0.0016 |
| 2 | Today Daily Change % | 0.12% |
| 3 | Today daily open | 1.3664 |
The pair remains strongly bullish on the daily timeframe. It trades above its 20 SMA @ 1.3669, 50 SMA 1.3503, 100 SMA @ 1.351 and 200 SMA @ 1.3344.
| Trends | Trends.1 | |
|---|---|---|
| 0 | Daily SMA20 | 1.3669 |
| 1 | Daily SMA50 | 1.3503 |
| 2 | Daily SMA100 | 1.3510 |
| 3 | Daily SMA200 | 1.3344 |
The previous day high was 1.3747 while the previous day low was 1.3652. The daily 38.2% Fib levels comes at 1.3688, expected to provide resistance. Similarly, the daily 61.8% fib level is at 1.3711, expected to provide resistance.
Note the levels of interest below:
- Pivot support is noted at 1.3628, 1.3592, 1.3533
- Pivot resistance is noted at 1.3724, 1.3783, 1.3819
| Levels | Levels.1 |
|---|---|
| Previous Daily High | 1.3747 |
| Previous Daily Low | 1.3652 |
| Previous Weekly High | 1.3828 |
| Previous Weekly Low | 1.3652 |
| Previous Monthly High | 1.3666 |
| Previous Monthly Low | 1.3262 |
| Daily Fibonacci 38.2% | 1.3688 |
| Daily Fibonacci 61.8% | 1.3711 |
| Daily Pivot Point S1 | 1.3628 |
| Daily Pivot Point S2 | 1.3592 |
| Daily Pivot Point S3 | 1.3533 |
| Daily Pivot Point R1 | 1.3724 |
| Daily Pivot Point R2 | 1.3783 |
| Daily Pivot Point R3 | 1.3819 |
[/s2If]
Join Our Telegram Group
")


