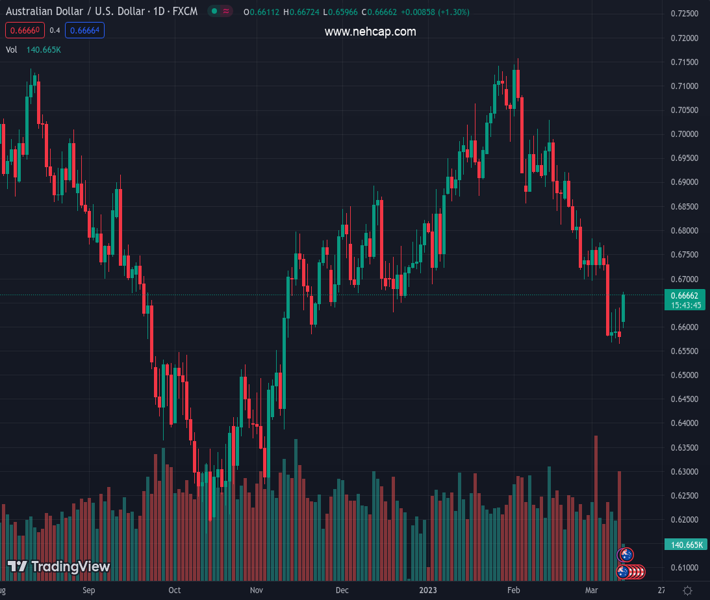
#AUDUSD @ 0.66664 stays on the front foot near intraday high as bulls cheer the biggest daily gains in almost two months. (Pivot Orderbook analysis)
…
This is a premium post.
[s2If !current_user_can(access_s2member_level4)]Please register for PREMIUM VERSION HERE to read full post below containing analysis. In case of any error or you think you are not able to read the full post below, please email us at support#nehcap.com [lwa][/s2If] [s2If current_user_can(access_s2member_level4)]
- AUD/USD stays on the front foot near intraday high as bulls cheer the biggest daily gains in almost two months.
- SVB-led risk-on mood joins receding hawkish Fed bets to drown US Dollar.
- Fresh fears surrounding US-China ties fail to derail risk-on mood.
The pair currently trades last at 0.66664.
The previous day high was 0.664 while the previous day low was 0.6564. The daily 38.2% Fib levels comes at 0.6593, expected to provide support. Similarly, the daily 61.8% fib level is at 0.6611, expected to provide support.
AUD/USD bulls celebrate the biggest daily gains since early February around the 0.6665-70 hurdle during early Monday in Europe. The Aussie pair’s latest inaction could be linked to its struggle to overcome the five-week-old descending resistance line amid the broadly risk-on mood, as well as the US Dollar weakness.
While portraying the mood, S&P 500 Futures bounced off a 2.5-month low, up nearly 1.60% around 3,960 by the press time. It’s worth noting that the Asia-Pacific equities trade mixed as they’re yet to overcome Friday’s bond and stock market rout, as well as bear the burden of China-linked fears.
A new term for China’s President Xi Jinping keeps the Sino-American tension on the table as he said earlier on Monday that they must resolutely oppose the interference of external forces, ‘split’ of Taiwan. It’s worth mentioning that Wall Street saw the red on Friday while the US bond yields also dropped the most in a month amid fears emanating from the Silicon Valley Bank (SVB) fallout.
However, the US Treasury Department, Federal Reserve and the Federal Deposit Insurance Corporation (FDIC) took joint actions to tame the risks during the weekend. While reacting to the US regulators’ actions, US President Joe Biden said, “American people and American businesses can have confidence that their bank deposits will be there when they need them.”
The fallout of the SVB and Signature Bank flagged fragile conditions of the US banks, which in turn pushed back hopes of more rate hikes from the US Federal Reserve (Fed). With this in mind, Goldman Sachs expects to rate hike in March while the Fed Fund Futures also cut previously upbeat odds favoring a 0.50% rate lift in the Fed rate in March.
Amid these plays, US Dollar Index (DXY) drops to the lowest level in a month, down 0.80% near 103.80.
Looking ahead, Tuesday’s US Consumer Price Index (CPI) for February to direct immediate market moves. Following that, the Retail Sales and preliminary readings of the Michigan Consumer Sentiment Index for March, up for publishing on Wednesday and Friday, will be crucial for AUD/USD traders to watch. At home, Thursday’s Aussie jobs report will be observed to reconfirm recent dovish bias surrounding the Reserve Bank of Australia (RBA).
A five-week-old descending resistance line, around 0.6665 by the press time, challenges the AUD/USD bulls.
Technical Levels: Supports and Resistances
AUDUSD currently trading at 0.6666 at the time of writing. Pair opened at 0.6576 and is trading with a change of 1.37% % .
| Overview | Overview.1 | |
|---|---|---|
| 0 | Today last price | 0.6666 |
| 1 | Today Daily Change | 0.0090 |
| 2 | Today Daily Change % | 1.37% |
| 3 | Today daily open | 0.6576 |
The pair remains strongly bearish on the daily time frame. It trades below the 20 SMA @ 0.6777, 50 SMA 0.6885, 100 SMA @ 0.6765 and 200 SMA @ 0.6777.
| Trends | Trends.1 | |
|---|---|---|
| 0 | Daily SMA20 | 0.6777 |
| 1 | Daily SMA50 | 0.6885 |
| 2 | Daily SMA100 | 0.6765 |
| 3 | Daily SMA200 | 0.6777 |
The previous day high was 0.664 while the previous day low was 0.6564. The daily 38.2% Fib levels comes at 0.6593, expected to provide support. Similarly, the daily 61.8% fib level is at 0.6611, expected to provide support.
Note the levels of interest below:
- Pivot support is noted at 0.6547, 0.6517, 0.6471
- Pivot resistance is noted at 0.6623, 0.667, 0.6699
| Levels | Levels.1 |
|---|---|
| Previous Daily High | 0.6640 |
| Previous Daily Low | 0.6564 |
| Previous Weekly High | 0.6770 |
| Previous Weekly Low | 0.6564 |
| Previous Monthly High | 0.7158 |
| Previous Monthly Low | 0.6698 |
| Daily Fibonacci 38.2% | 0.6593 |
| Daily Fibonacci 61.8% | 0.6611 |
| Daily Pivot Point S1 | 0.6547 |
| Daily Pivot Point S2 | 0.6517 |
| Daily Pivot Point S3 | 0.6471 |
| Daily Pivot Point R1 | 0.6623 |
| Daily Pivot Point R2 | 0.6670 |
| Daily Pivot Point R3 | 0.6699 |
[/s2If]
Join Our Telegram Group
")


