#USDJPY @ 134.108 holds lower ground after refreshing a one-month bottom., @nehcap view: Further downside expected (Pivot Orderbook analysis)
…
This is a premium post.
[s2If !current_user_can(access_s2member_level4)]Please register for PREMIUM VERSION HERE to read full post below containing analysis. In case of any error or you think you are not able to read the full post below, please email us at support#nehcap.com [lwa][/s2If] [s2If current_user_can(access_s2member_level4)]
- USD/JPY holds lower ground after refreshing a one-month bottom.
- U-turn from the DMAs, rejection of bullish channel and the strongest bearish MACD signals since early February to favor sellers.
- Early February tops may test Yen pair bears ahead of 50-SMA.
- Buyers remain off the table unless witnessing a clear break of 200-DMA.
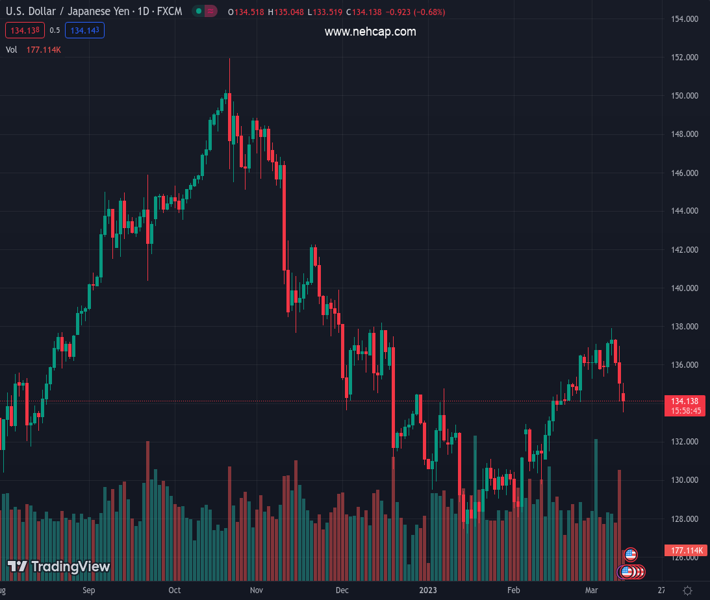
The pair currently trades last at 134.108.
The previous day high was 137.0 while the previous day low was 134.12. The daily 38.2% Fib levels comes at 135.22, expected to provide resistance. Similarly, the daily 61.8% fib level is at 135.89, expected to provide resistance.
USD/JPY bears keep the reins for the third consecutive day heading into Monday’s European session. In doing so, the Yen pair seesaws around the lowest levels in one month, marked earlier in the day, as sellers poke the 134.00 threshold.
A clear U-turn from the 200-DMA, as well as a downside break of the 100-DMA, joins a sustained downside break of a five-week-old bullish channel to favor USD/JPY sellers. On the same line could be the strongest bearish MACD signals since early December 2022.
With this, the Yen pair appears all set to slump toward the 50-DMA support of 132.50. However, the early February swing highs near 132.90 seem to prod the USD/JPY sellers of late.
In a case where the USD/JPY price remains bearish past the 50-DMA, the 130.00 round figure and the previous monthly low surrounding 128.00 will be in the spotlight.
On the flip side, a convergence of the 100-DMA and the aforementioned channel’s lower line, close to 135.85, holds the key to USD/JPY pair’s recovery.
Even so, the 200-DMA can test the upside momentum near 137.50 before directing prices towards the aforementioned channel’s top line, close to 139.50 at the latest.
Trend: Further downside expected
Technical Levels: Supports and Resistances
USDJPY currently trading at 133.93 at the time of writing. Pair opened at 134.86 and is trading with a change of -0.69% % .
| Overview | Overview.1 | |
|---|---|---|
| 0 | Today last price | 133.93 |
| 1 | Today Daily Change | -0.93 |
| 2 | Today Daily Change % | -0.69% |
| 3 | Today daily open | 134.86 |
The pair is trading below its 20 Daily moving average @ 135.26, above its 50 Daily moving average @ 132.41 , below its 100 Daily moving average @ 135.98 and below its 200 Daily moving average @ 137.48
| Trends | Trends.1 | |
|---|---|---|
| 0 | Daily SMA20 | 135.26 |
| 1 | Daily SMA50 | 132.41 |
| 2 | Daily SMA100 | 135.98 |
| 3 | Daily SMA200 | 137.48 |
The previous day high was 137.0 while the previous day low was 134.12. The daily 38.2% Fib levels comes at 135.22, expected to provide resistance. Similarly, the daily 61.8% fib level is at 135.89, expected to provide resistance.
Note the levels of interest below:
- Pivot support is noted at 133.65, 132.44, 130.77
- Pivot resistance is noted at 136.53, 138.2, 139.41
| Levels | Levels.1 |
|---|---|
| Previous Daily High | 137.00 |
| Previous Daily Low | 134.12 |
| Previous Weekly High | 137.91 |
| Previous Weekly Low | 134.12 |
| Previous Monthly High | 136.92 |
| Previous Monthly Low | 128.08 |
| Daily Fibonacci 38.2% | 135.22 |
| Daily Fibonacci 61.8% | 135.89 |
| Daily Pivot Point S1 | 133.65 |
| Daily Pivot Point S2 | 132.44 |
| Daily Pivot Point S3 | 130.77 |
| Daily Pivot Point R1 | 136.53 |
| Daily Pivot Point R2 | 138.20 |
| Daily Pivot Point R3 | 139.41 |
[/s2If]
Join Our Telegram Group
")


