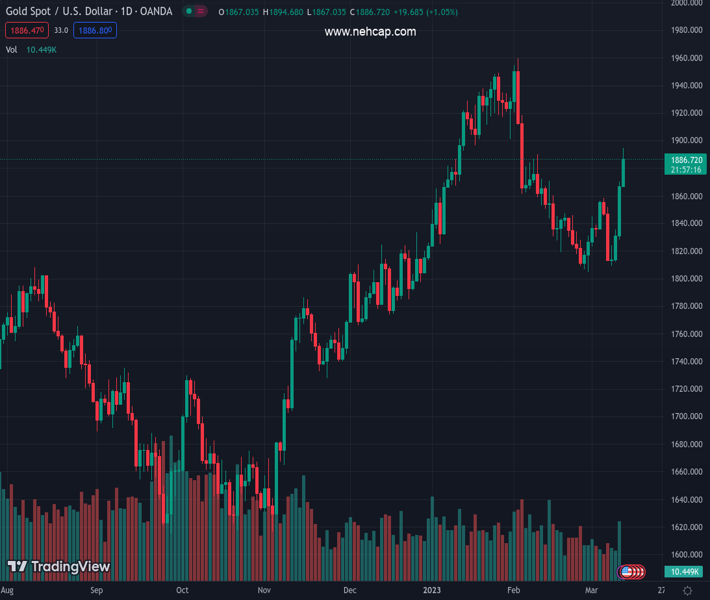
#XAUUSD @ 1,888.81 Gold price retreats from one-month high after rising in the last two consecutive weeks., @nehcap view: Further upside expected (Pivot Orderbook analysis)
…
This is a premium post.
[s2If !current_user_can(access_s2member_level4)]Please register for PREMIUM VERSION HERE to read full post below containing analysis. In case of any error or you think you are not able to read the full post below, please email us at support#nehcap.com [lwa][/s2If] [s2If current_user_can(access_s2member_level4)]
- Gold price retreats from one-month high after rising in the last two consecutive weeks.
- Fears emanating from Silicon Valley Bank drowned United States Treasury bond yields, US Dollar and propel haven demand of XAU/USD.
- Better-than-expected US Nonfarm Payrolls (NFP) failed to impress US Dollar buyers amid Silicon Valley Bank’s fallout.
- US Consumer Price Index, Federal Reserve’s efforts to defend SVB eyed for clearly predicting Gold price.
The pair currently trades last at 1888.81.
The previous day high was 1870.09 while the previous day low was 1827.77. The daily 38.2% Fib levels comes at 1853.92, expected to provide support. Similarly, the daily 61.8% fib level is at 1843.94, expected to provide support.
Gold Price (XAU/USD) pares the daily gains as it retreats from the highest levels in five weeks, marked earlier in the day, to $1,885 by the press time of early Asian session on Monday. In doing so, the precious metal struggles to extend the previous two-week uptrend as the United States Treasury Department and Federal Reserve (Fed) take actions on defend the financial market crisis risk emanating from Silicon Valley Bank. That said, the XAU/USD ignored better than forecast US Nonfarm Payrolls (NFP) to renew the one-month high, before rallying to a five-week top earlier in the day, as the US Dollar traced downbeat Treasury bond yields.
United States Treasury Department, Federal Reserve and the Federal Deposit Insurance Corporation (FDIC) took join actions to tame the risks emanating from the Silicon Valley Bank (SVB) fallout during the weekend and exert downside pressure on Gold price of late. “Taking decisive actions to protect the US economy by strengthening public confidence in our banking system,” said the US Treasury Department and Federal Reserve (Fed) in joint statements on the action plan to defend the Silicon Valley Bank (SVB). Market sentiment improved after the news release as the US regulators also closed the Signature Bank and announced plans to make depositors whole. While portraying the mood, S&P 500 Futures and the US Treasury bond yields rise after a downbeat close the previous day. It should be noted that the market sentiment roiled on Friday after the SVB spread risks of another financial crisis.
Also read: US Treasury Department, Fed unveil action plan on Silicon Valley Bank fallout
On Friday, United States Nonfarm Payrolls (NFP) grew more than 205K expected to 311K in February, versus 504K (revised), while the Unemployment Rate rose to 3.6% for the said month compared to 3.4% expected and prior. Further, the Avearage Hourly Earnings rose on YoY but eased on monthly basis for February whereas the Labor Force Participation increased during the stated month. Despite mostly upbeat US data, the US Dollar failed to improve as risks from the Silicon Valley Bank (SVB) fallout drowned the US Treasury bond yields. However, the recent US regulators’ actions may redirect the market players towards remembering the upbeat US jobs report and renew the hawkish Fed bets ahead of next week’s Federal Reserve (Fed) monetary policy meeting, which in turn could weigh on the Gold price.
Gold price manages to cheer a sustained bounce off 61.8% Fibonacci retracement level of November 2022 to February 2023 upside of around $1,812, also known as golden Fibonacci ratio.
Adding strength to the bullish bias surrounding the XAU/USD is a successful upside break of a nine-week-old horizontal hurdle, now immediate support near $1,860.
That said, the bullish signals from the Moving Avearage Convergence and Divergence (MACD) indicator joins upbeat but not overbought appearance of the Relative Strength Index (RSI) line, placed at 14.
With this, the XAU/USD run-up towards the 23.6% Fibonacci retracement level surrounding $1,904, as well as a challenge to the previous monthly top of near $1,960, can’t be ruled out.
On the contrary, Gold sellers may return to the table if the quote struggles to remain beyond the aforementioned horizontal resistance-turned-support of around $1,860. It should be noted that the 50-DMA can restrict immediate downside near $1,872.
Adding to the downside filters are 50% and 61.8% Fibonacci retracement levels near $1,840 and $1,812. It’s worth noting that the 100-DMA level level of $1,810 apperas the last defense of the Gold buyers.
To sum up, Gold price gains buyer’s attention ahead of the key United States data but a sustained trading beyond $1,871 could help strengthen the bullish bias.
Trend: Further upside expected
Technical Levels: Supports and Resistances
XAUUSD currently trading at 1881.72 at the time of writing. Pair opened at 1869.92 and is trading with a change of 0.63 % .
| Overview | Overview.1 | |
|---|---|---|
| 0 | Today last price | 1881.72 |
| 1 | Today Daily Change | 11.80 |
| 2 | Today Daily Change % | 0.63 |
| 3 | Today daily open | 1869.92 |
The pair remains strongly bullish on the daily timeframe. It trades above its 20 SMA @ 1835.48, 50 SMA 1871.07, 100 SMA @ 1810.46 and 200 SMA @ 1775.06.
| Trends | Trends.1 | |
|---|---|---|
| 0 | Daily SMA20 | 1835.48 |
| 1 | Daily SMA50 | 1871.07 |
| 2 | Daily SMA100 | 1810.46 |
| 3 | Daily SMA200 | 1775.06 |
The previous day high was 1870.09 while the previous day low was 1827.77. The daily 38.2% Fib levels comes at 1853.92, expected to provide support. Similarly, the daily 61.8% fib level is at 1843.94, expected to provide support.
Note the levels of interest below:
- Pivot support is noted at 1841.76, 1813.61, 1799.44
- Pivot resistance is noted at 1884.08, 1898.25, 1926.4
| Levels | Levels.1 |
|---|---|
| Previous Daily High | 1870.09 |
| Previous Daily Low | 1827.77 |
| Previous Weekly High | 1870.09 |
| Previous Weekly Low | 1809.46 |
| Previous Monthly High | 1959.80 |
| Previous Monthly Low | 1804.76 |
| Daily Fibonacci 38.2% | 1853.92 |
| Daily Fibonacci 61.8% | 1843.94 |
| Daily Pivot Point S1 | 1841.76 |
| Daily Pivot Point S2 | 1813.61 |
| Daily Pivot Point S3 | 1799.44 |
| Daily Pivot Point R1 | 1884.08 |
| Daily Pivot Point R2 | 1898.25 |
| Daily Pivot Point R3 | 1926.40 |
[/s2If]
Join Our Telegram Group
")


